Tom Goddard
Advisory Committee meeting
March 21, 2016
Demonstrations of ChimeraX viewing, analyzing, and modeling with "next generation" 3d data sets.
These 3 demonstrations illustrate recent progress corresponding to the 3 specific aims of our proposed Technology Research and Development project (TR&D 2) on ChimeraX applications.
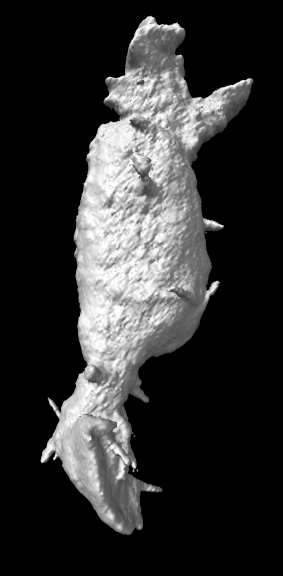
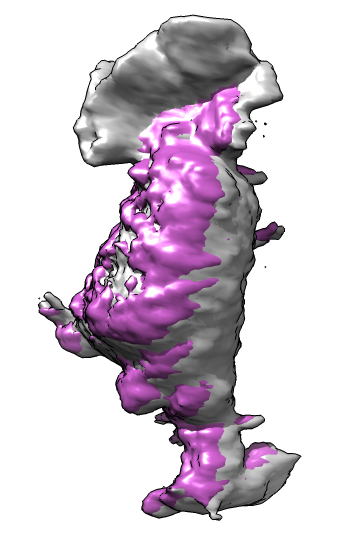
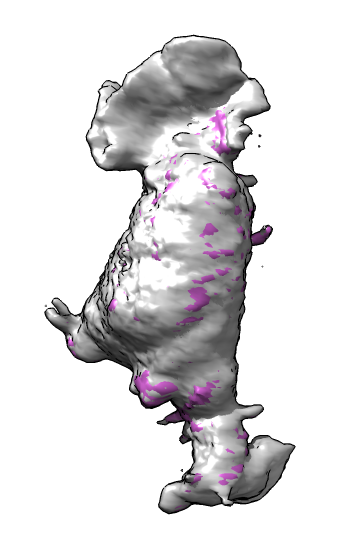
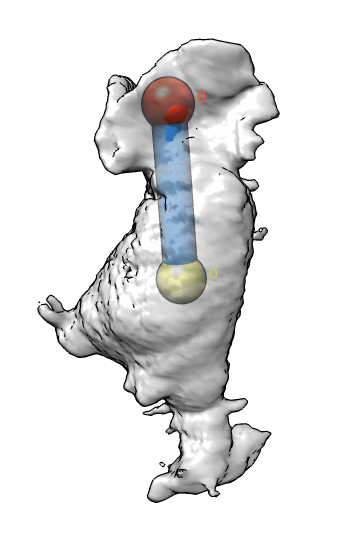
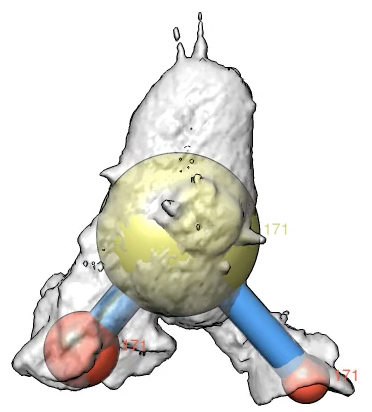
How to quantify the lamellipodia protrusions of moving neutrophils seen in 3d optical microscopy.
|
|
|
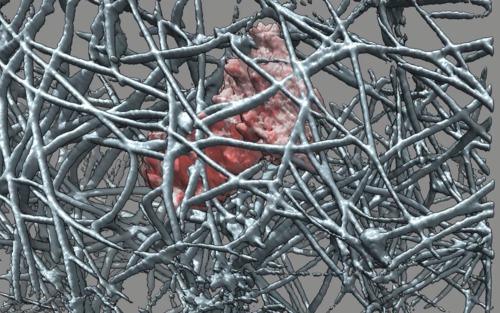
| Movie. | Crawling through collagen filaments. Movie. |
| 
| 
| 
| 
| 
| 
|
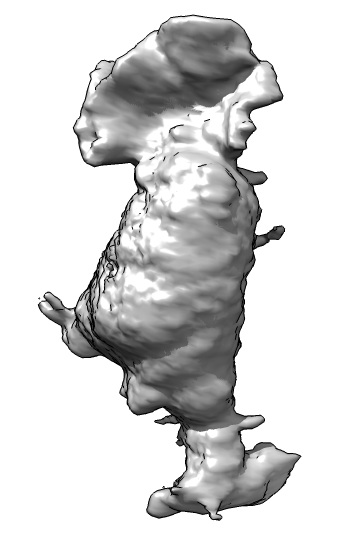
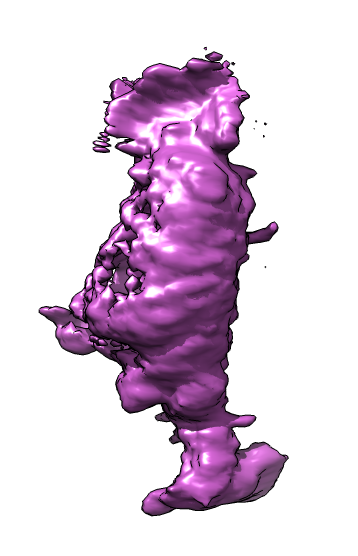
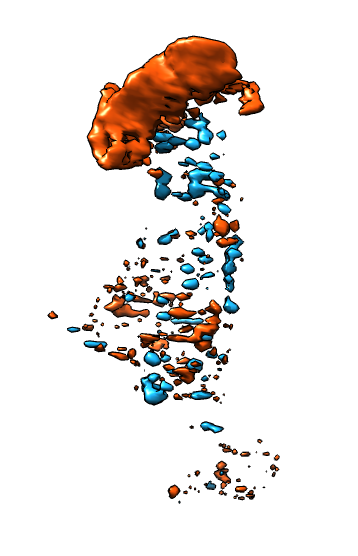
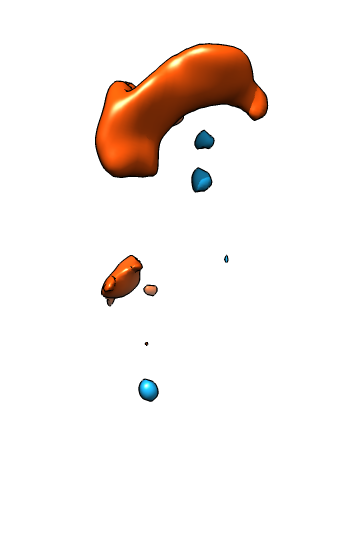
| Membrane | Actin | Imperfect alignment | Aligned | Difference map (positive orange, negative blue) | Smoothed difference | Mark largest connected blobs and cell center |
| 
|
| Movie of marked protrusions, 250 frames. |
Protrusion sizes and angular separation versus time. Plot of protrusion size measured as sphere radius for sphere with volume matching protrusion volume seen in smoothed difference map. Red, green and blue curves are the largest protrusions ordered by size. Angular separation of protrusions is measured (pink circles) as the average angle between cell center to protrusion center vectors. |
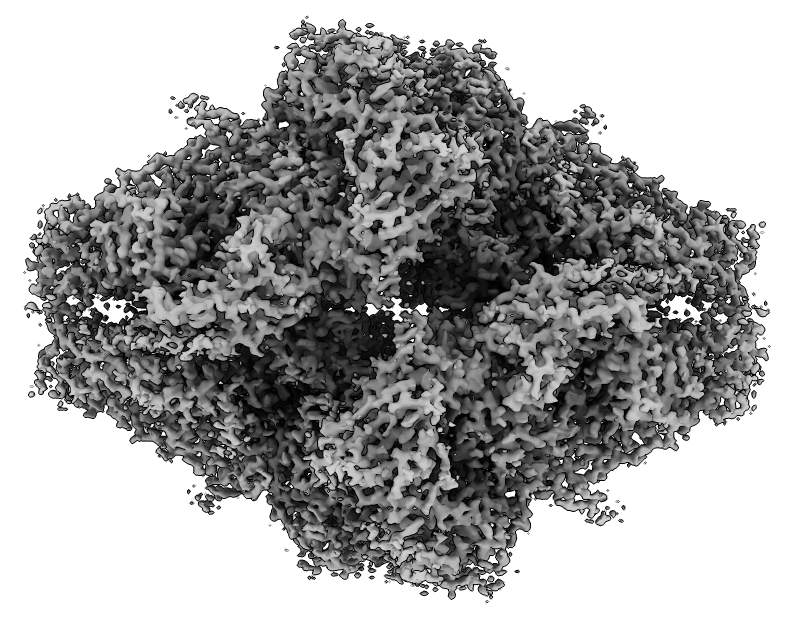
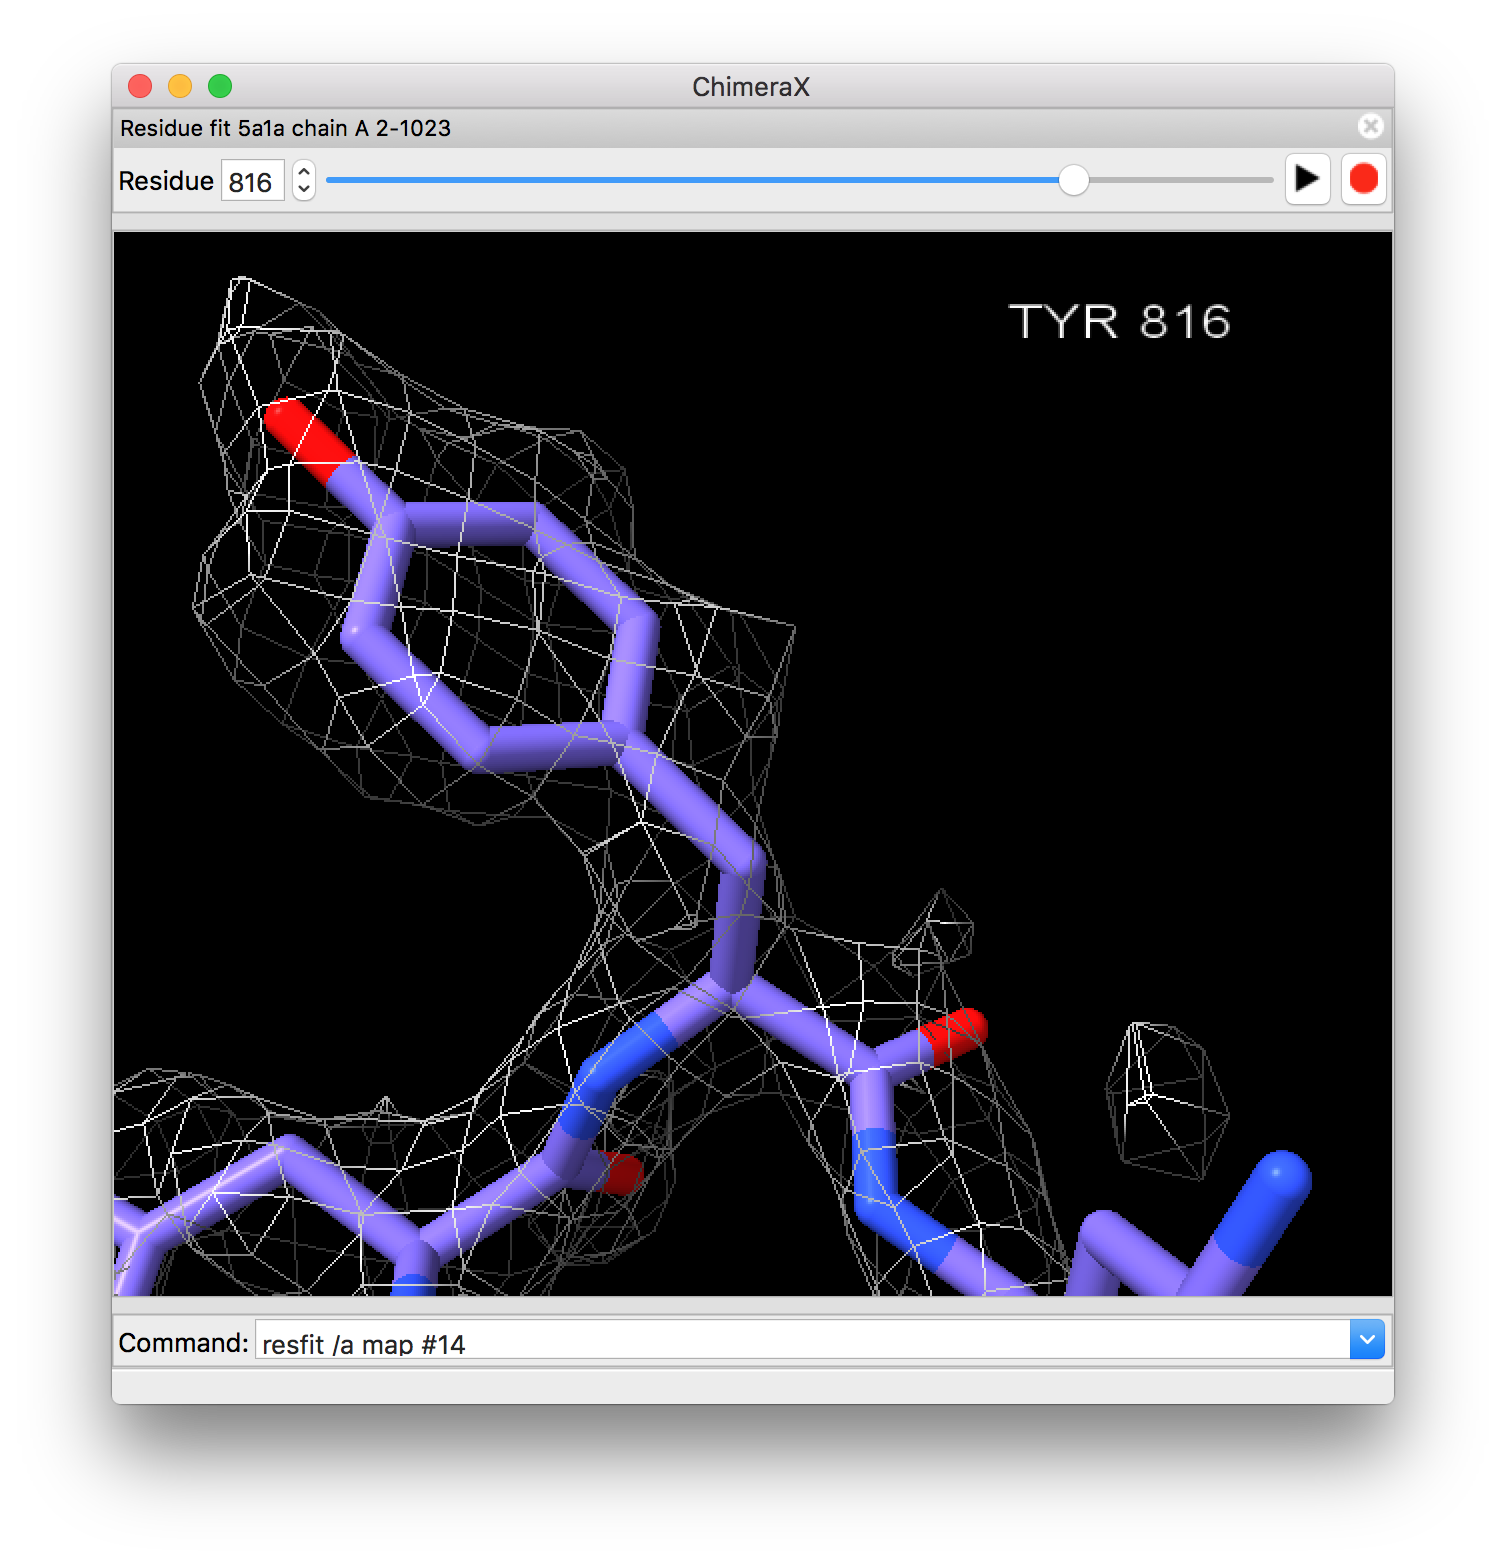
Inspecting fit of individual residues in atomic resolution cryoEM maps.
| 
|
| Beta galactosidase cryoEM map at 2.2 Angstroms (EMDB 2984). | Atomic model (PDB 5a1a) |
| |
| Residue fit inspector in ChimeraX. Movie. | Movie showing each residue fit. |
Viewing and building molecular models containing tens of thousands of macro-molecules. Graham Johnson's cellPACK software and ChimeraX tools build these theoretical models.
.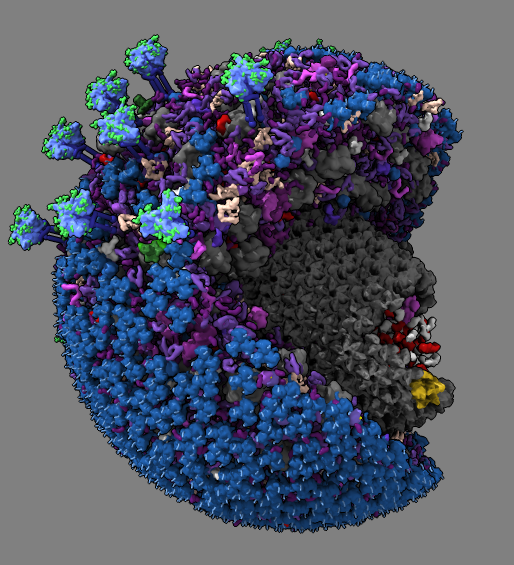
| 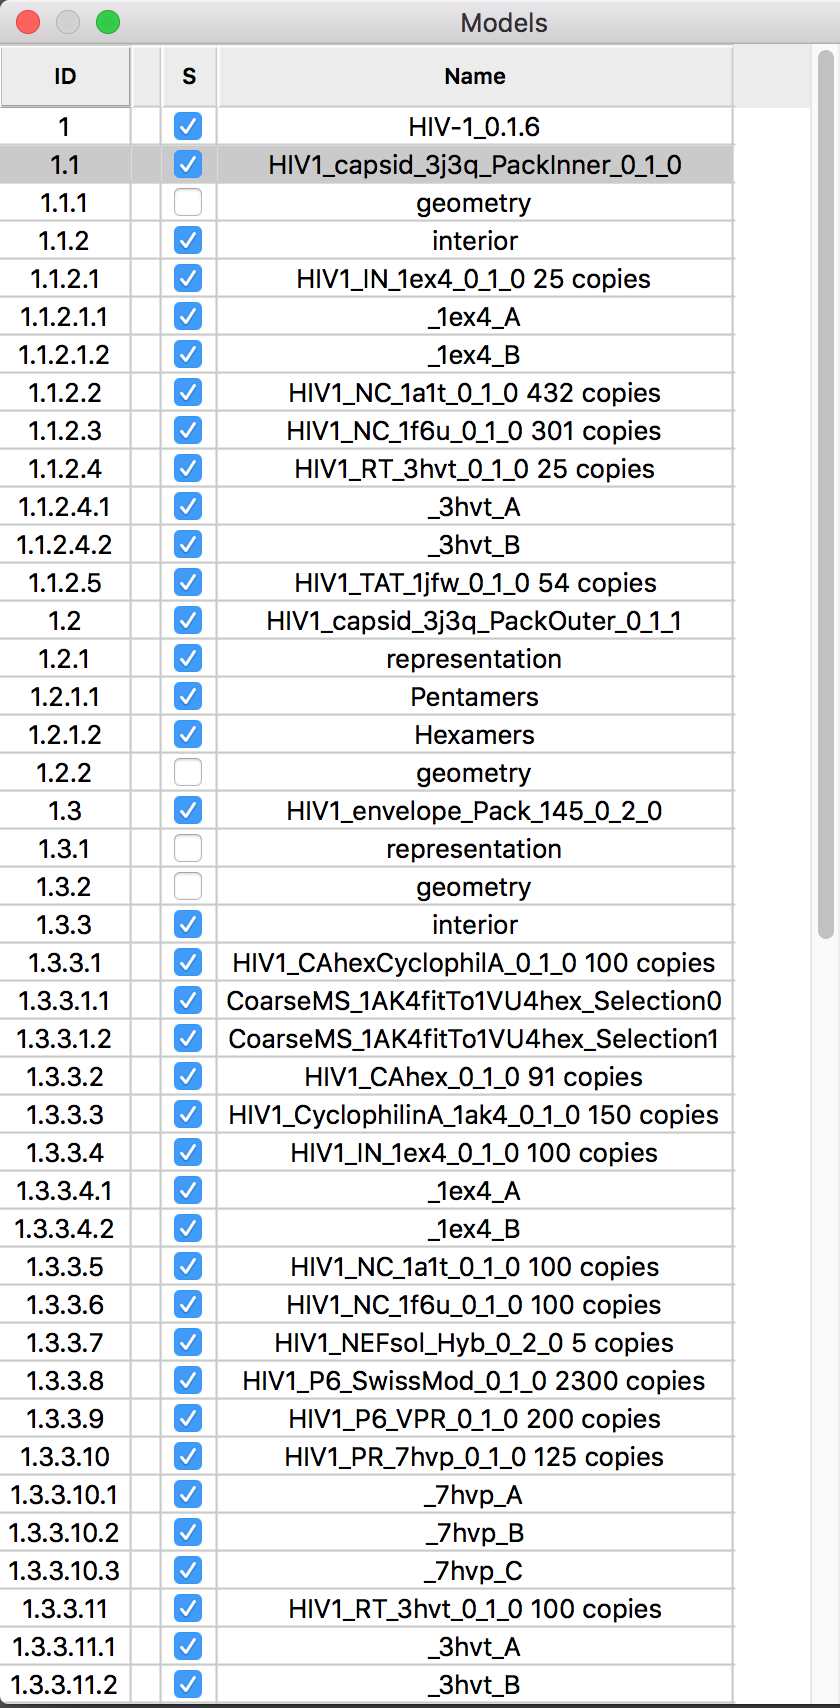
| 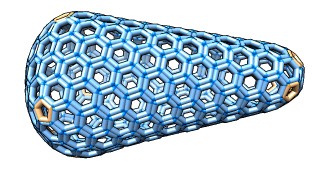
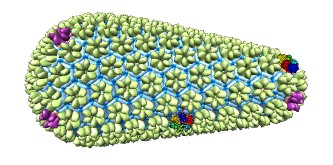
|
| Partially revealing layers of HIV cellPACK model using drag select. | Hierarchy for HIV model proteins. | Building an HIV capsid lattice of protein hexamers and pentamers. |