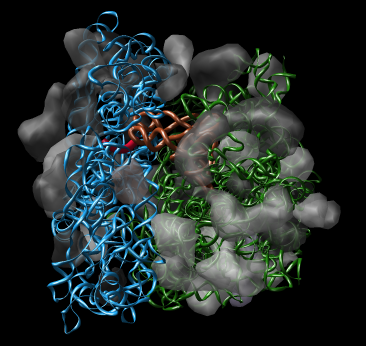
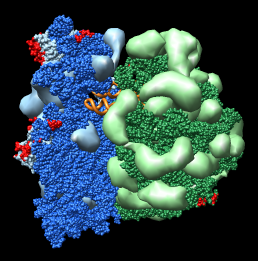
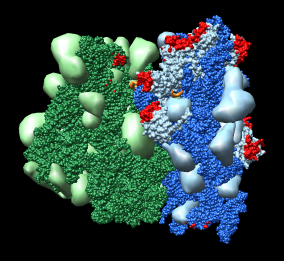
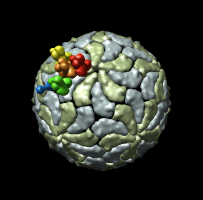
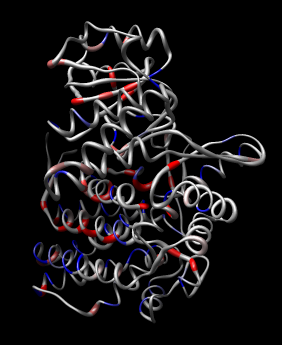
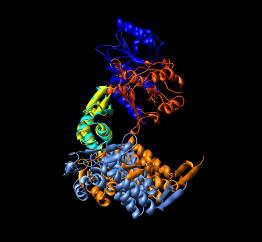
Figure 1: Ribosome architecture. E. coli 70S ribosome (1pns / 1pnu) with proteins shown as transparent surfaces and RNA shown as ribbons. Green is large subunit 23S and 5S rRNA. Blue is small subunit 16S rRNA. Orange are two tRNAs. Red is mRNA.
Thomas Goddard and Thomas Ferrin
Resource for Biocomputing, Visualization, and Informatics
University of California, San Francisco
Presented at the
workshop
on Visualization of Large Biomolecular Complexes
September 11-13, 2005
This page is available in PDF format.
I used 1pns / 1pnu instead of 1pnx / 1pny because the former include tRNA and mRNA. The location of the tRNAs is important in understanding the significance of these structures.
|
|
Figure 1: Ribosome architecture. E. coli 70S ribosome (1pns / 1pnu) with proteins shown as transparent surfaces and RNA shown as ribbons. Green is large subunit 23S and 5S rRNA. Blue is small subunit 16S rRNA. Orange are two tRNAs. Red is mRNA. |
|
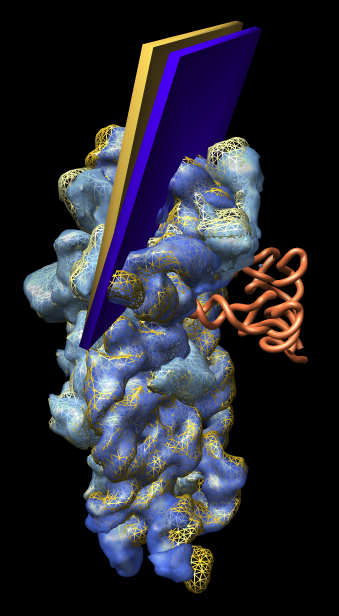
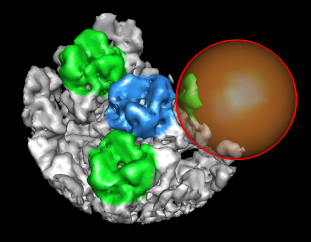
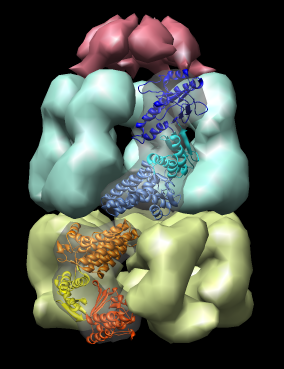
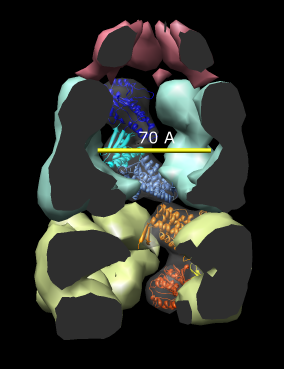
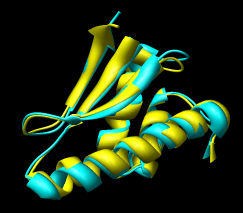
Figure 2: Small subunit head tilt. Comparison of shapes of E. coli small subunit 1pns (rRNA blue surface, proteins light blue surface, tRNA orange tube) and T. thermophilus small subunit 1n34 (rRNA orange mesh, proteins yellow mesh). The head of the small subunit (top third) is leaning into the tRNAs more in E. coli than in T. thermophilus. The head tilt is approximately 5 degrees as illustrated by the slabs with hinge axis passing through the two 16S rRNA helices that join the small subunit head to the body (lower two thirds). The T. thermophilus small subunit was crystallized alone and has the open form. Comparisons with other structures show that all 70S ribosomes have the closed form (head leaning in) independent of whether tRNA is present. This weighs against the hypothesis that the open to closed form transition is involved in tRNA recognition. |

|

|
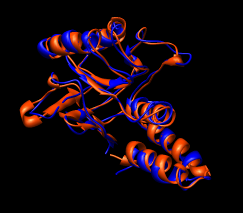
Figure 3: Crystal contacts. Crystal contact areas were excluded from alignments in Vila-Sanjurjo, et al. used to determine head tilt. Upper left Crystal packing of E. coli 70S ribosome 1pns (blue) / 1pnu (green) showing 3 by 3 by 3 unit cells containing 432 ribosomes.Upper right: Crystal contacts within 5 angstroms. Contact areas are shown in red. Lower left and right: Front and back views showing contact atoms in red. Contacting proteins shown as molecular surfaces. Contacting RNA molecules shown as spheres. Other proteins shown as low resolution surfaces. |
|
|
Background from paper on PDB models 1pns, 1pnu:
This is a
9.5 angstrom crystal structure divided into two files (small subunit
30S, 1pnx and large subunit 50S, 1pny) to work around the 100,000 atom
limitation of the PDB file format. At this resolution the atomic
detail and residue positioning are not meaningful. The 1pnx file
includes all non-hydrogen atoms while the 1pny file has only CA atoms
for proteins. The atomic and residue level detail comes from a
T. thermophilus 30S small subunit (1j5e) at 3.05 angstroms resolution,
and from the D. radiodurans 50S large subunit (1nkw superceding 1lnr)
at 3.10 angstroms resolution. The low resolution 1pnx/1pny structure
was used to investigate two hypotheses about the recognition of tRNA
molecules matching the mRNA template: that a large conformational
change of the small subunit (open vs closed head and body) is
relevant, and that a rRNA helix switch conformation is relevant. The
study involved a hyper-accurate E. coli ribosome mutant that needs the
error-inducing antibiotic streptomycin to function. They also solved
that structure with two tRNAs and a short mRNA ligand at 8.7 angstroms
resolution (1pns and 1pnu). They made comparisons to T. thermophilus
30S structures in open conformation (1n34, 3.8A) and closed conformation
(1ibl, 3.11A), and the whole T. thermophilus ribosome (1gix, 5.5A).
Primary citation for PDB models 1pns, 1pnu:
Vila-Sanjurjo, A. Ridgeway, W.K. Seymaner, V. Zhang, W. Santoso,
S. Yu, K. Cate, J.H.D. X-ray crystal structures of the WT and a
hyper-accurate ribosome from Escherichia coli Proc.Natl.Acad.Sci.USA,
v100, pp.8682-8687, 2003
PubMed
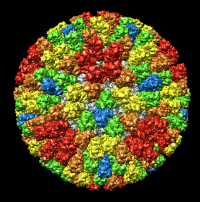
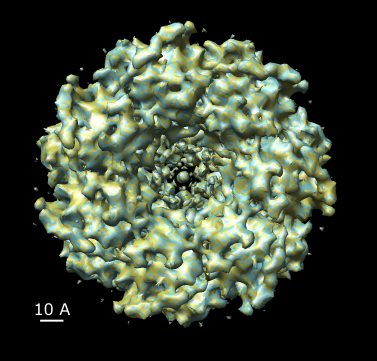
This 6 angstrom rice dwarf cryo-EM map EMD 1060 was determined prior to the 3.5 angstrom crystal structure PDB 1uf2. The basic architecture of the virus capsid could be seen in the 1998 bluetongue virus crystal structure PDB 2btv (3.5 angstroms).
|
|
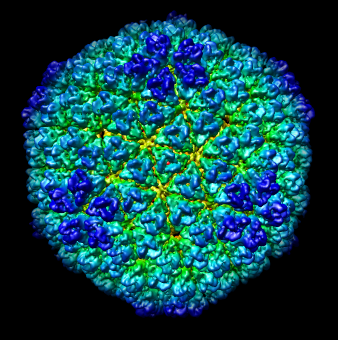
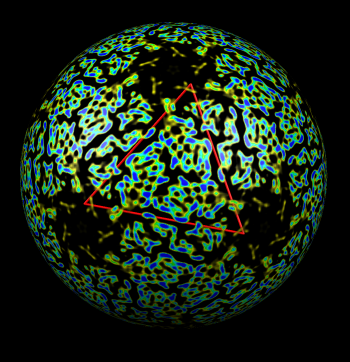
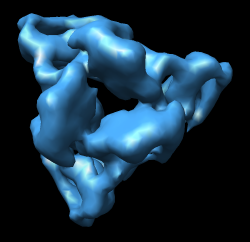
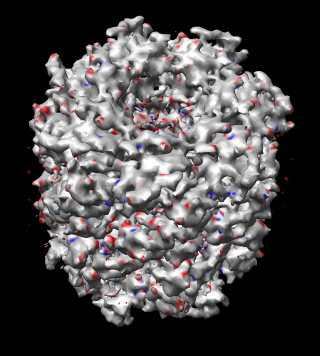
| Figure 4: Radial coloring. Coloring based on distance from the center of virus, red to blue. Note that the 5-fold symmetry axes stick out (dark blue). | Figure 5: Spherical slice. Density values on a sphere slicing through the inner capsid layer. Blue is high density, yellow low density. Three copies of the P3 inner layer protein arranged about a 3-fold symmetry axis can be seen in the red triangle. |
|

|
|
|
| Figure 5: Crystal models. Left 2 images: Inner layer of rice dwarf crystal structure with proteins individually surfaced and asymmetric unit of outer layer (8 angstrom surfacing). Full outer layer shown with trimers colored by symmetry class (3 angstrom surfacing). Right 2 images: Crystal structure of bluetongue virus (PDB 2btv) is more spherical but has the same architecture. | |||
|
|
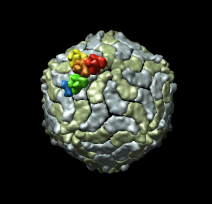
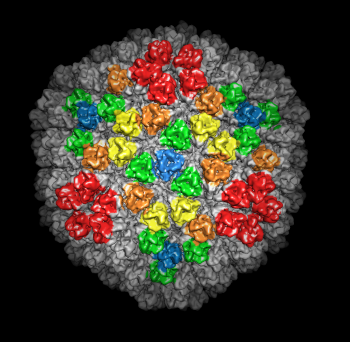
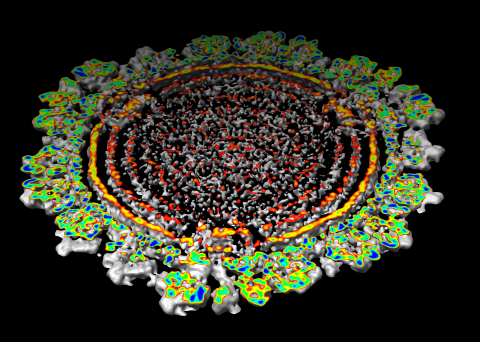
| Figure 6: Marked map. Symmetry-related trimers are colored on the map by placing markers at the center of trimers and coloring nearby surface points. | Figure 7: Cross-section slab. 20 angstrom thick slab, threshold 0.9, colored by density value. Red and orange concentric rings are double-stranded RNA. Inner protein layer is innermost ring of blue and green beads about as thick as bright yellow ring. Three pores along 5-fold axes are seen extending into interior. |

|
|
|
| Figure 8: Extract piece. A spherical piece of the map (20 nm diameter) shown opaque is put into a separate file. | Figure 9: Segmenting trimer. The transparent orange sphere is used to chop away pieces of the map. The sphere is moved about 50 times by hand and resized as needed to zero all density around the central trimer. | Figure 10: Segmented out trimer. One of the trimers segmented from the map and saved in a separate file. |
Background. GroEL is a barrel-shaped 14-mer with monomers arranged in two stacked rings of seven proteins. It is part of the GroEL / GroES complex called chaperonin which folds proteins inside the barrel. The monomeric GroEL protein has three domains which move as rigid bodies in different conformations of the complex.
|
|
|
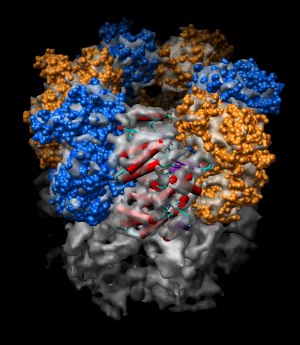
| Figure 11: Hand docking. Crystal model PDB 1oel docked to 6 angstrom cryo-EM map EMD 1081. Six monomers are shown as blue and orange molecular surfaces. One is shown with red tubes for helices, purple for sheets, and cyan for strands. | Figure 12: Monomer. Closeup of a docked monomer from PDB 1oel. | Figure 13: Fit quality. Model 1oel backbone with color and thickness representing average cryo-EM map density at atom positions for each residue. Red and fat represents low density, blue and thin represents high density. |
Domain motions in GroEL / GroES complex. Crystal structure PDB 1aon (resolution 3 angstroms) shows large motions of the three domains of the GroEL protein. The proteins in the two GroEL rings have identical amino acid sequence but assume different conformations.
|
| Figure 14: GroEL and GroES. PDB model 1a0n with GroES cap (red) and GroEL rings (blue and yellow) shown with low resolution surfaces, outside and cutaway views. One monomer from each GroEL ring is shown as a ribbon. |
|
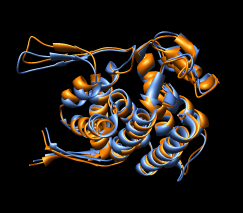
| Figure 15: GroEL monomer conformations. Comparison of GroEL monomers with three domains colored as in the previous figure. Right image shows a superposition with central domains aligned. |
|
|
|
Figure 16: Domain alignments. Alignments of the individual domains from the two monomer conformations show that the domains are essentially rigid.
Computational docking. It makes sense to computationally dock the three domains of PDB 1oel to the cryo-EM map to achieve an optimal fit. Our group has not written computational docking code so I will not demonstrate that.
Rotational symmetry: The meta-data for model PDB 1oel and map EMD 1081 do not say whether 7-fold rotational symmetry was imposed. Comparing the model 1oel with itself rotated shows that 7-fold symmetry was not imposed. Comparing the map 1081 with a rotated copy of itself suggests 14-fold symmetry was imposed in the map reconstruction. The following figure compares the map with a rotated copy of itself.
|
|
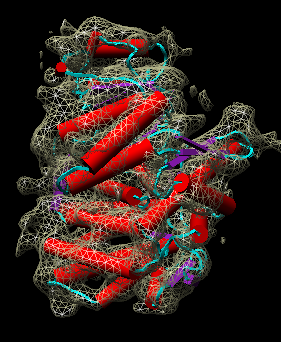
| Figure 17: Map symmetry. Map EMD 1081 superimposed on itself rotated by 3/7 turn. Left: Contour surfaces of map (blue) and rotated map (gold) at same threshold show mottling at the resolution of the grid (2.08 A). Right: Variations in density between map and rotated copy. Red is 15% lower density, blue is 15% higher. | |
Rotational symmetry, more details
Aligning 1oel with itself rotate 1/7 turn gives all atom RMSD 0.862A and CA only 0.847A. Aligning individual chains with other chains (CA only) gives RMSD values in the range 0.3 - 0.6 angstroms. These small deviations from 7-fold symmetry are not significant in hand docking to the 6A map.
7-fold rotational symmetry of the 6-A map appears to be accurate to within what is achievable with the 2.08 angstrom grid spacing (the grid not having 7-fold symmetry). Superposing two copies of the map rotated relative to one another with contour surfaces in different colors shows a mottled appearance at the level of individual triangles. Likewise when one copy is flipped end to end they look identical to within grid spacing limits. Appears that 14-fold symmetry was imposed. (Would be nice if the emd-1081.xml meta-data described whether exact symmetry was imposed in the reconstruction, 7-fold or 14-fold.)