Poster for NCRR Principal Investigator meeting, June 2002.
Tom Goddard, Conrad Huang, Greg Couch, Eric Pettersen, Elaine Meng, Thomas Ferrin
Resource for Biocomputing, Visualization and Informatics
University of California, San Francisco
This poster describes some of the extensions available in Chimera, a molecular modeling system developed by the UCSF Computer Graphics Laboratory.
Chimera allows developers to quickly incorporate novel algorithms and analysis tools. It provides graphic rendering and data management so the developer can focus on coding features unique to their application. About 30 extensions have been written. They are written in the Python programming language, which is easy to learn and offers object-oriented features. Molecular data is managed in C++ for efficiency but is all available from Python as well. Extensions can bring up their own custom interfaces using the Python Tkinter module.
Chimera is available from http://www.cgl.ucsf.edu/chimera. It runs on Microsoft Windows, Intel Linux, SGI workstations, and Compaq Alpha workstations. It is free for non-commercial use.
This work is supported by the NIH National Center for Research Resources grant P41-RR01081.
The Chimera Volume Viewer and Path Tracer extensions allow display and modeling of volumemetric data. We are interested in studying large molecular systems such as whole chromosomes and viruses using a combination of atomic resolution structures and electron microscope data.
| 1A
| B
| D
|
| C
|
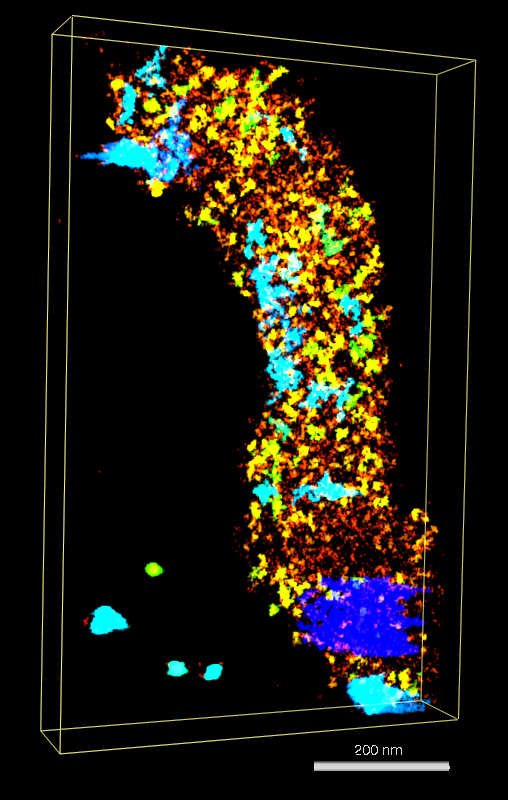
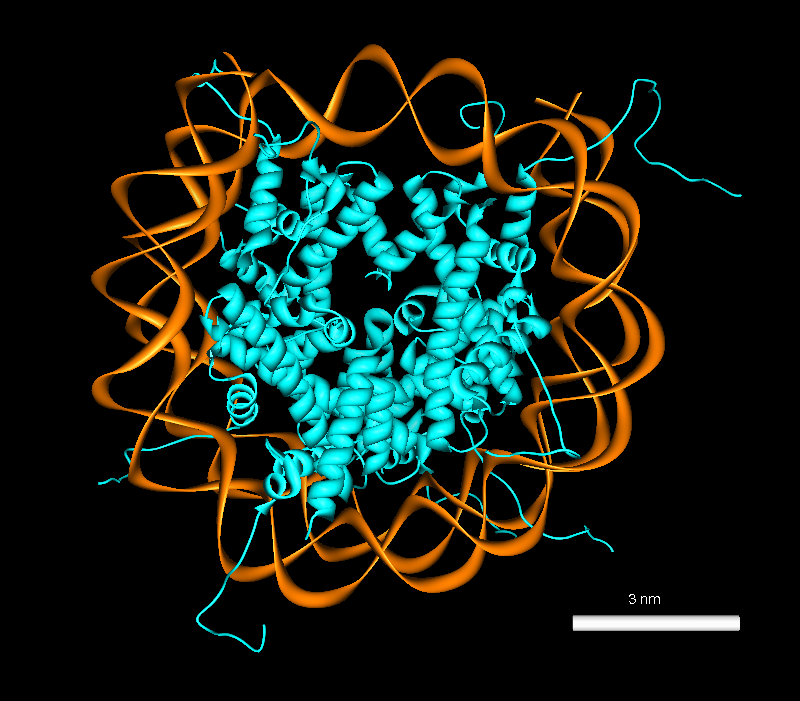
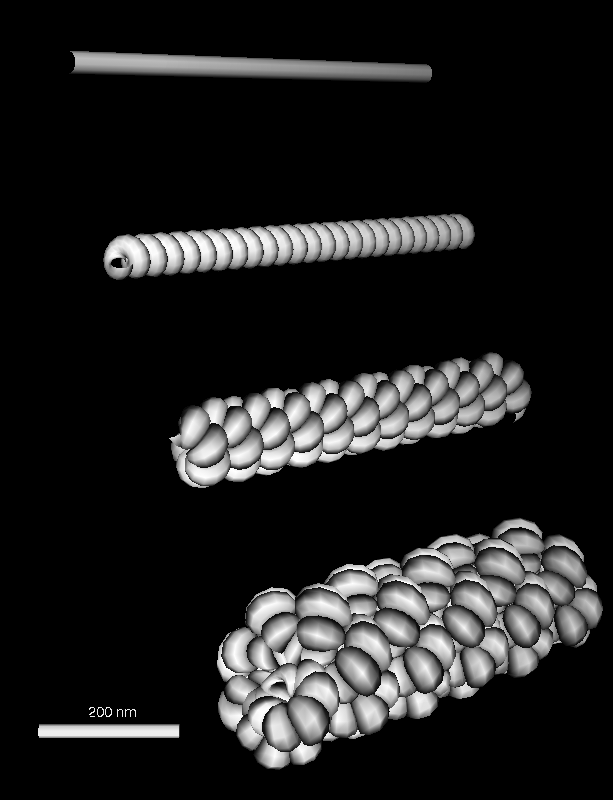
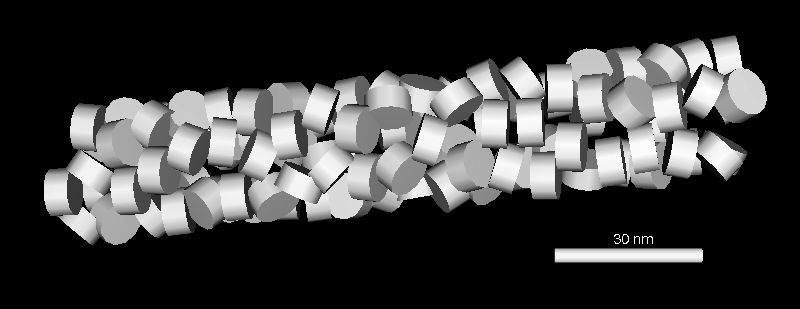
Figure 1: We collaborate with John Sedat's lab at UCSF to understand the packaging of DNA in chromosomes. A) Electron microscope tomography of a condensed Drosophila chromosome. Poor stain specificity makes structural characterization difficult. Connected substructures are colored by their volume to distinguish featues of different sizes. B) Crystal structure of a nucleosome wound with 146 base pairs of DNA. C) Conceptual model of how nucleosomes are packaged in a 30 nm chromatin fiber. D) Multi-level helix model showing how chromatin might be folded in a chromosome. Models C and D were created with special purpose Python code.
2A 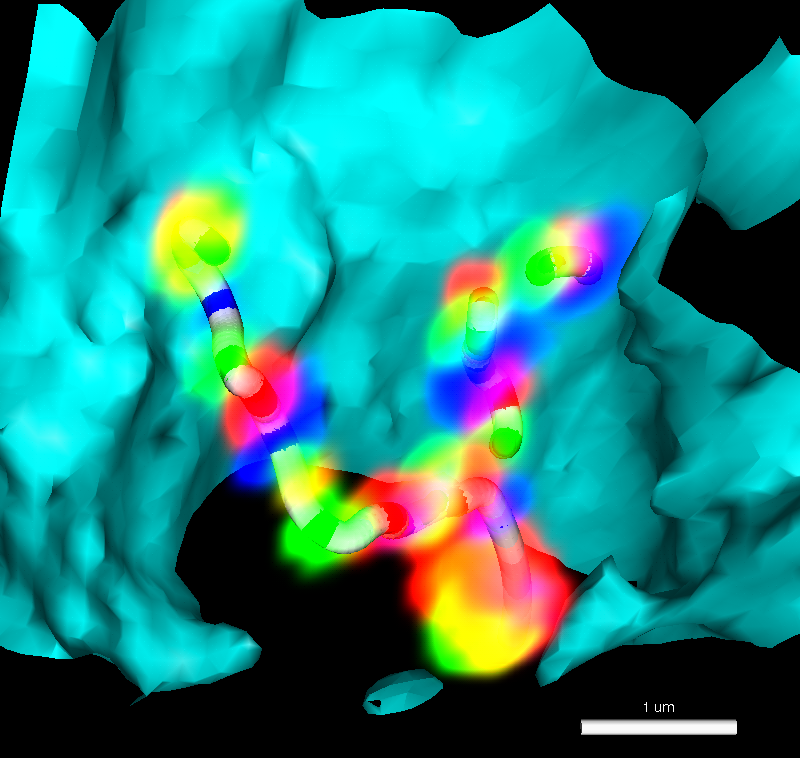
| B 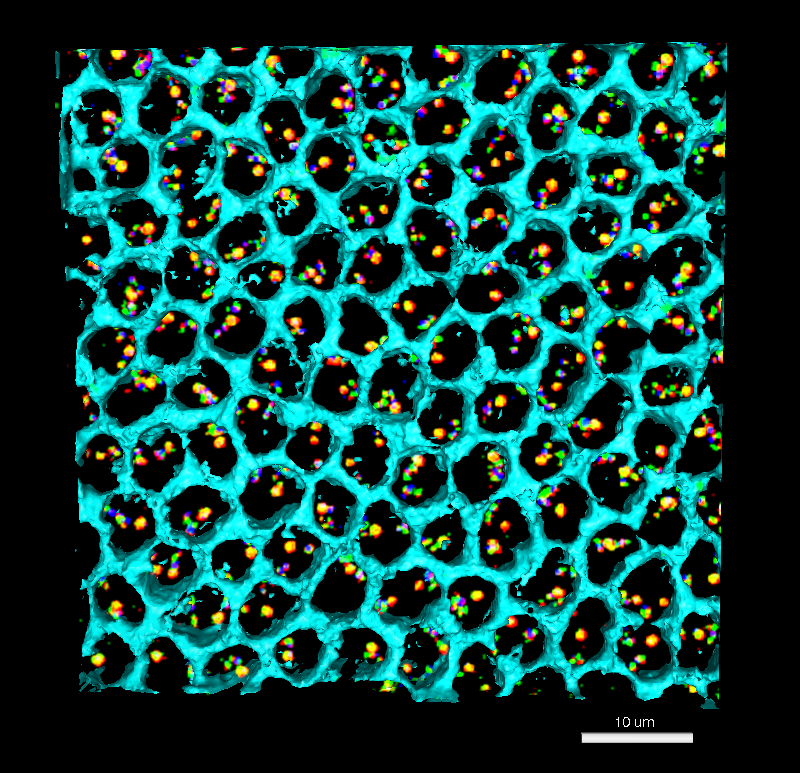
|
Figure 2: John Sedat's group is also interested in the spatial layout of chromosomes within the cell nucleus. Chromosome sites that attach to the nuclear envelope may have significance for gene transcription. A) Light microscope volume showing fluorescently labeled Drosophila chromosome. Three fluorophors label specific segments of the chromosome. The labeled segments are approximately 10 kilo-basepairs (kbp) in length and are separated by about 100 kbp. Two homologous chromosomes are seen. The cyan surface depicts the nuclear envelope. The tubes were created with the Chimera path tracer extension. B) About 100 cells are imaged at once using wide-field deconvolution microscopy to obtain a 3 dimensional data set. Each cell from the data set is analyzed individually. Hundreds of cells are analyzed to make statistical statements about chromosome spatial layout in the nucleus.
3A 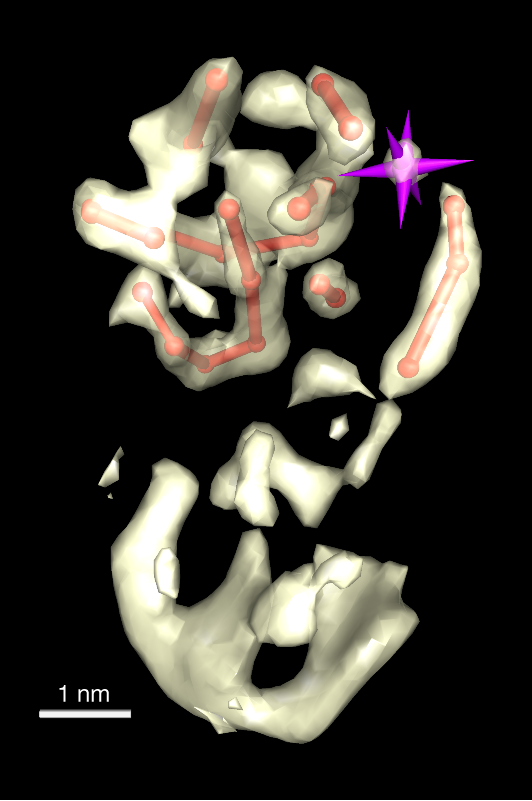
| B 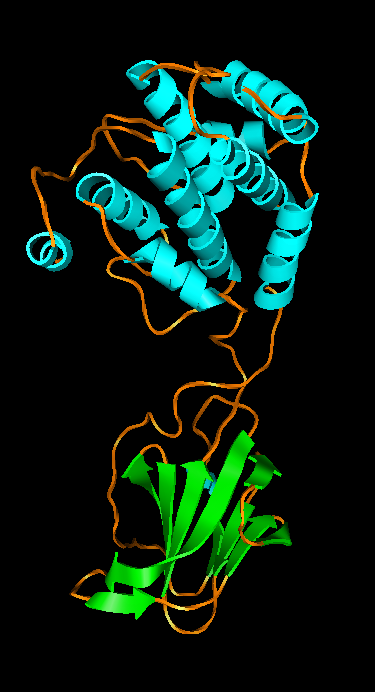
| C 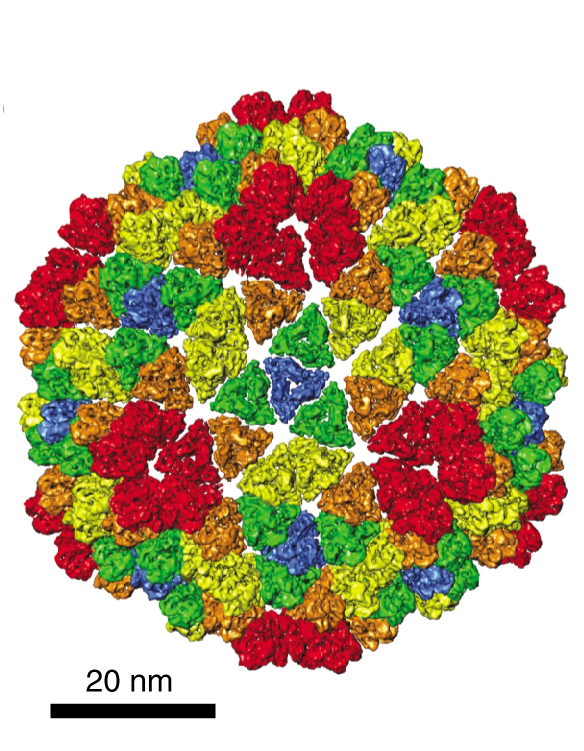
|
Figure 3: Wah Chiu's group at Baylor College of Medicine studies viruses using electron microscopy. Thousands of randomly oriented virus particles are imaged to reconstruct a high resolution density map. A) Density map of P8 capsid protein of Rice Dwarf virus. Alpha helices are easily recognized in this 7 angstrom resolution density map. Markers can be placed on the density map and connected to trace the protein backbone. The purple cross is the pointer used with a Phantom force feedback device for placing and connecting markers. B) A crystal structure of P7 capsid protein from Bluetongue virus in the same virus family. There is less than 20% sequence identity to the Rice Dwarf virus capsid protein but the alpha helix and beta sheet domains have some similarity. C) Rice Dwarf virus particle icosahedral outer shell contains of 260 P8 trimers in 5 different symmetry classes shown in different colors from Zhou ZH et al., Nat Struct Biol 2001 Oct;8(10):868-73
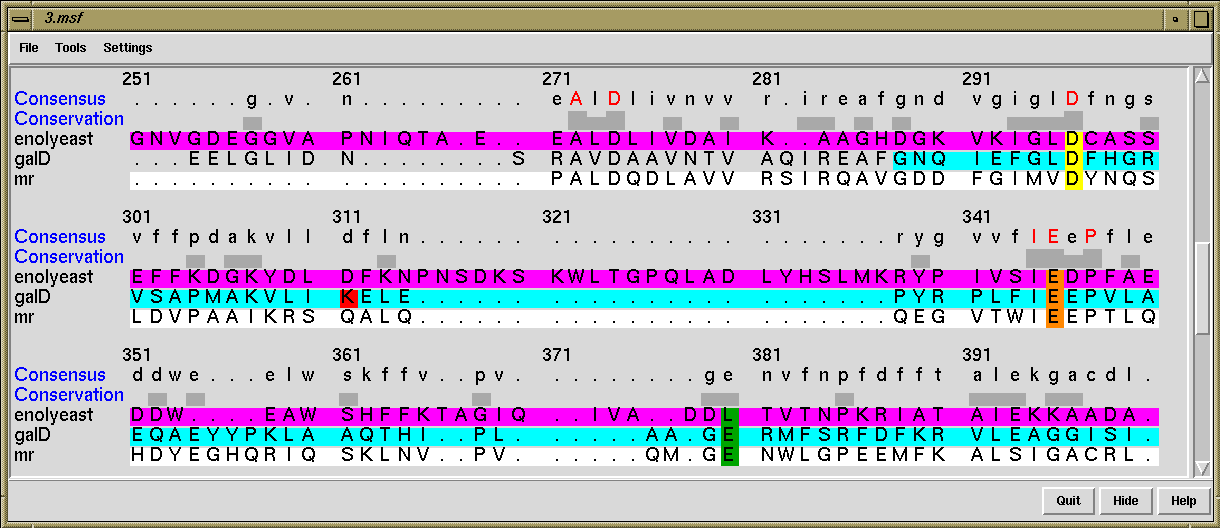
The Multalign Viewer extension displays multiple sequence alignments, calculates and shows a consensus sequence and conservation histogram, and allows regions to be defined and colored. Structures opened in Chimera are automatically associated with a matching sequence. When a region is defined by dragging within the sequence, the corresponding residues of the structure are highlighted.
| 
|
This example from Patsy Babbitt's group at UCSF shows an alignment of 3 protein sequences and their structures from the enolase superfamily. Patsy's group is characterizing superfamilies of enzymes whose member proteins perform a broad range of biochemical functions while sharing a common active site architecture.
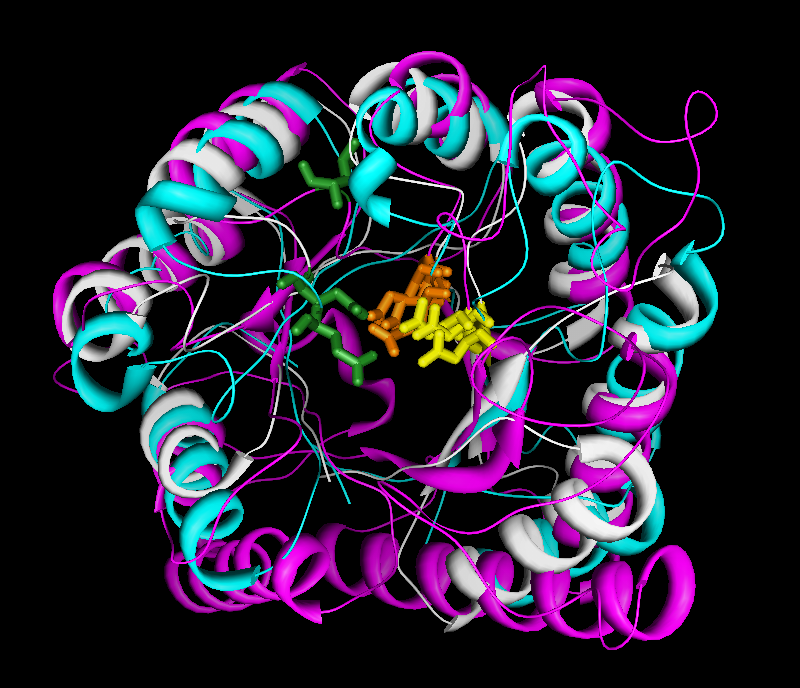
The sequences and corresponding structures are shown in matching colors. Three sequence positions are shown in yellow, orange and green. These are functional active site residues, with exception of the enolyeast green residue seen far from the center of the alpha/beta barrel. These residues and a few others not shown provide the machinery for abstracting a proton alpha to a carboxylic acid. This partial reaction is the common feature of enolase superfamily members.
The red lysine in the sequence dialog indicates a mismatch between the provided alignment sequence and structure sequence.
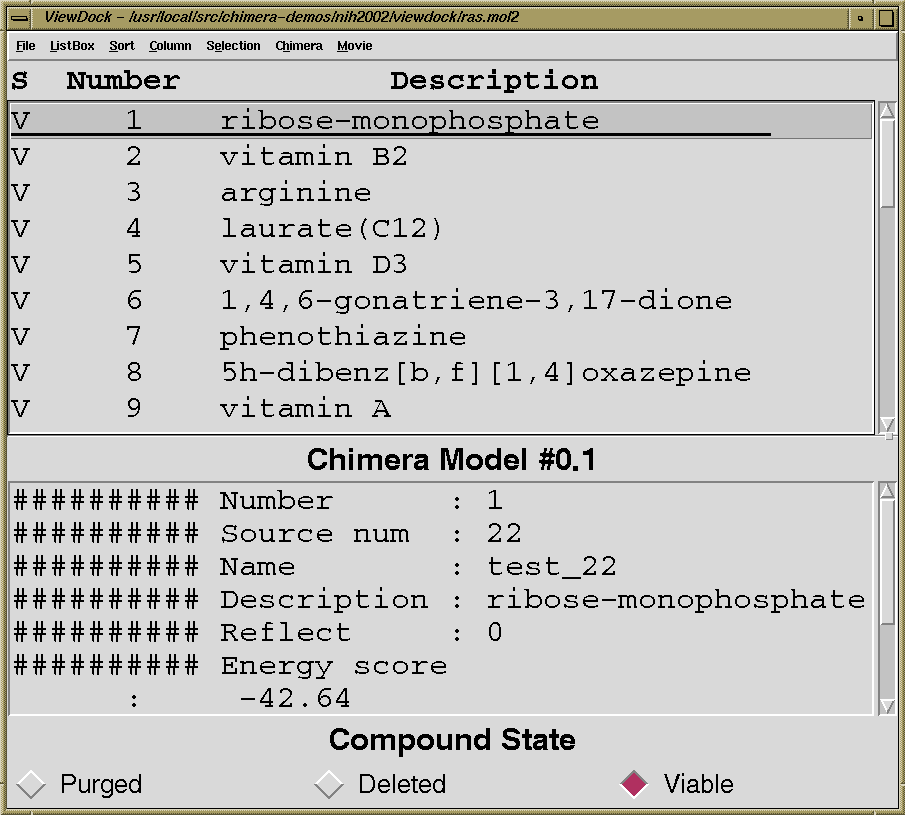
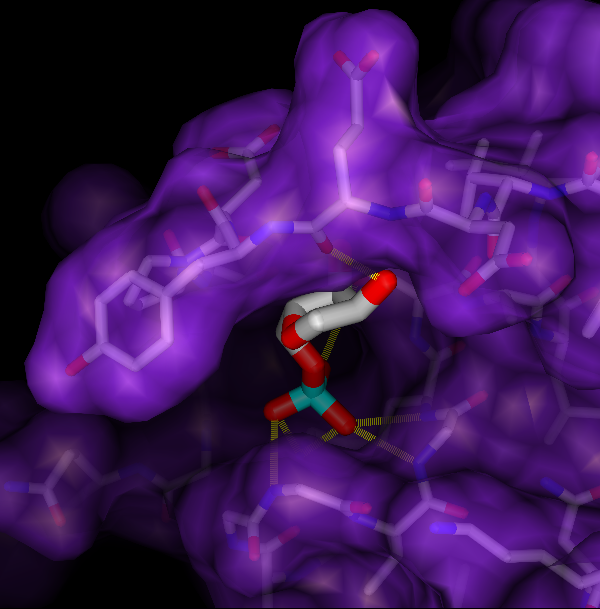
The program DOCK developed by Tack Kuntz's group at UCSF determines binding orientations, given structures of ligand and receptor molecules. Typically, a large database of small molecule structures is searched for compounds that may bind the receptor. The extension ViewDock facilitates interactive selection of promising compounds from the output of DOCK version 4. Clicking on a compound name displays that compound (usually in the context of a receptor site) in the graphics window and shows text scoring information. The user can mark each compound to be saved or discarded after individual inspection, and then write out the favorites. It is also possible to categorize compounds automatically based on the number of hydrogen bonds formed to the receptor or a selected portion of the receptor. Possible hydrogen bonds are detected by the extension FindHBond; the criteria are adjustable.
| 
|
The example shows ribose monophosphate docked to H-Ras (PDB entry 121P). Mutations of the H-Ras gene are found with high frequency in malignant tumors in humans. Oxygens are red, nitrogens are blue, and phosphate is cyan. Hydrogens are not shown. Potential hydrogen bonds are shown as dashed yellow lines between donor and acceptor.
©2004 The Regents, University of California; all rights reserved.