
Surface Color colors surface models and their caps by:
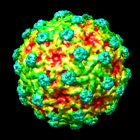
| radial coloring (by
distance from a point) |
 |
See also: APBS, DelPhiController, Render by Attribute, Values at Atom Positions, Rainbow, Color Zone, Color Key, Color Actions
Thanks to Steve Ludtke (Baylor College of Medicine) for developing the original version of this tool, Isosurface Colorizer (distributed with the EMAN package). The Chimera implementation uses C++ code to accelerate the color calculations.
There are several ways to start Surface Color, a tool in the Volume Data category (including from the Volume Viewer Tools menu). It is also implemented as the command scolor.
The same tool is available as Electrostatic Surface Coloring in the Surface/Binding Analysis category, and simply opening an electrostatic potential file will start this tool automatically.
The surface of interest should first be displayed and chosen from the menu next to Color surface. How to display a surface depends on its type. For example, a molecular surface can be displayed with Actions... Surface... show or the command surface, whereas a GRASP surface is displayed by opening a GRASP surface file. Any surface cap will be treated as part of the surface for coloring purposes. There is an option to color only the cap and not the rest of the surface.
Surface vertices are associated with values, either distances or values based on separate data. Clicking the Color button applies the specified value-to-color mapping. A surface will be recolored automatically if it changes shape. Uncolor reverts the chosen surface to its color in single-color mode. Caps will revert to the same color as the surface being capped, unless the Surface Capping option to use a separate color is turned on.
Choices for coloring by distance:
Choices for coloring by separate data:The origin and axis are specified in the untransformed coordinate system of the chosen surface, not the viewing coordinate system. The origin coordinates can be entered directly, or center can be clicked to set the origin to the center of the bounding box of the chosen surface.
- radius - distance from a point. The point is defined by the origin coordinates.
- cylinder radius - distance from an axis. The axis is defined by any point on the axis and a direction. The point is defined by the origin coordinates. The three values in the axis field specify direction. For example, (1 0 0), (0 1 0), and (0 0 1) specify directions along the X, Y, and Z axes, respectively. Any three values can be entered, however (the axis need not be parallel to the X, Y, or Z axis).
- height - topographic height, distance from a plane. The plane is defined by any point on the plane and a vector normal to the plane. The point is defined by the origin coordinates. The vector is defined by the values in the axis field, as described above.
If first started as Surface Color, the tool initially contains five colors in rainbow order; started as Electrostatic Surface Coloring, it contains red, white, and blue.If the potential file or volume file has not been opened already, click browse... to locate and open the file.
- electrostatic potential - values from a potential file
- volume data value - values from volume data
- volume gradient norm - how steeply volume data values change in space
Clicking any color well allows the color to be adjusted interactively, and the value associated with the color can be edited. There are options to set the colors and values automatically and to control the number of wells. If a value is blank, the corresponding color will not be used, and at least two values must be specified. However, if all values are blank when Color is clicked, the fields will be filled in as if the option to set the full range of values had been used.
Clicking the Options button reveals
additional settings that can be hidden again by clicking the small button
 on the right.
Per-pixel coloring. In per-pixel coloring, the data and the specified color/value pairs are used to set up a 3D texture (array of colors). OpenGL interpolates the texture to determine a color for each surface pixel. If it is not possible to create a 3D texture equal to the size of the volume, per-pixel coloring will not be performed. Some graphics graphics cards/drivers limit 3D texture size to 5123, and often a smaller limit is imposed by the graphics card memory. When per-pixel coloring is not done, the coloring is per-vertex: data are interpolated and colors mapped as described below.
Data value interpolation. The transformed coordinates of the surface and the data are used to map data values to surface vertices.
Color mapping. The color mapping is defined by the specified color/value pairs, or thresholds. The value associated with each surface vertex is compared to the thresholds. Vertices with values lower than any threshold are assigned the color of the lowest-value threshold, while vertices with values higher than any threshold are assigned the color of the highest-value threshold. The colors of the remaining vertices are obtained by linear interpolation between the nearest lower and higher thresholds. Finally, each surface triangle is colored by linearly interpolating its vertex colors. Colors are defined by red, green, blue and opacity/transparency components.
Subsequent coloring may erase molecular surface custom colors. Unless explicitly limited to non-surface items, subsequent use of Actions... Color or the command color on the molecule model corresponding to a molecular surface will reset the surface's color source to atoms and wipe out the Surface Color coloring. The custom surface coloring will be erased even when only parts of the molecule model that do not contribute to the molecular surface are recolored.
Independent centers of rotation should not be used. If the center of rotation method is set to independent, the relative positions of a molecular surface and an electrostatic potential map (or other volume data) will change as rotations are performed. Because the surface and map motions are not properly synchronized, the resulting coloring will be wrong. The other center of rotation methods do not cause this problem.