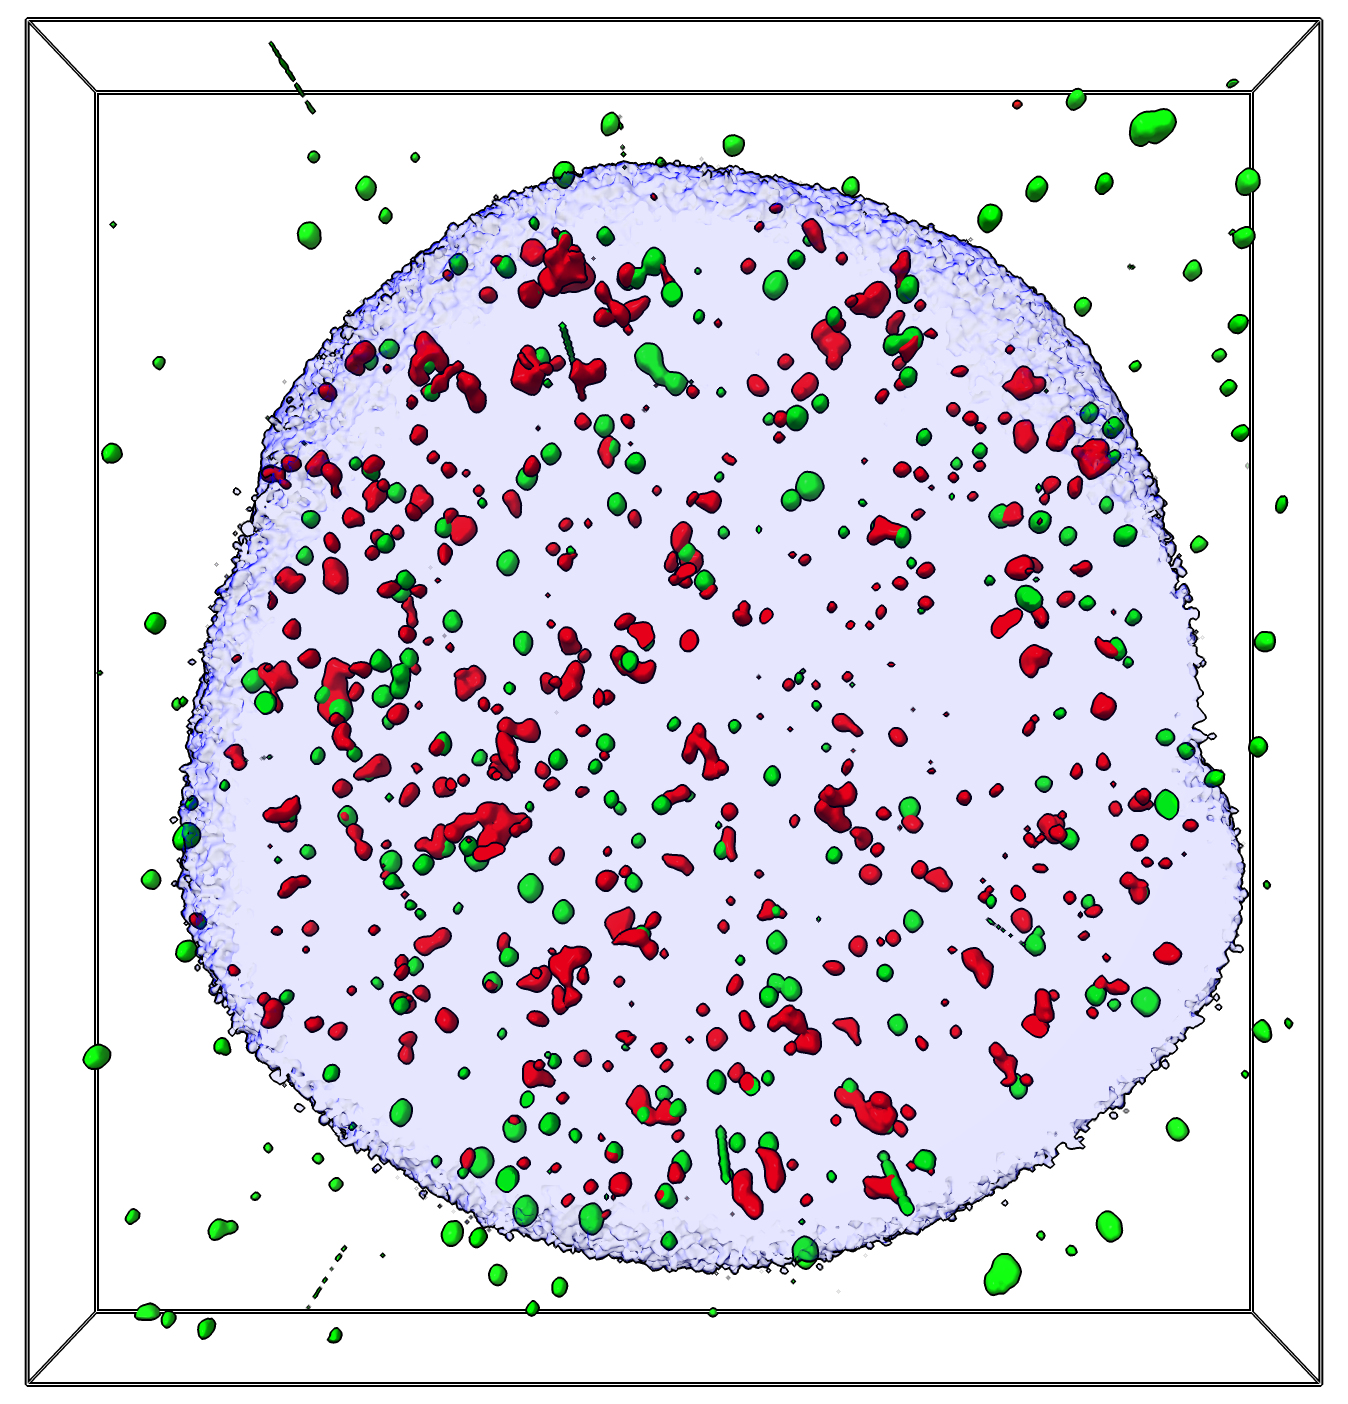
gh2ax red, ligase4 green, dapi blue
Tom Goddard June 21, 2024

gh2ax red, ligase4 green, dapi blue |
Here is a way to visualize colocalized fluorescent markers in 3D light microscopy using ChimeraX. I'll show how to display only the colocalized spots and a way to assess how much colocalization would be observed if the spots were randomly positioned.
Let's look at an etoposide treated human cell stained with DAPI to show all DNA and two flurophores ligase4 and gh2ax that label DNA damage from Laura Cheradame at UCSF. Here are the 3 channels dna_damage.cmap cropped to just one cell nucleus.
Open the image data in ChimeraX. You'll need a ChimeraX version from June 22, 2024 or newer to have the colocalization command we will use later. Set threshold levels.
      open dna_damage.cmap
      volume #1.1 level 1200
      volume #1.2 level 290
      volume #1.3 level 670
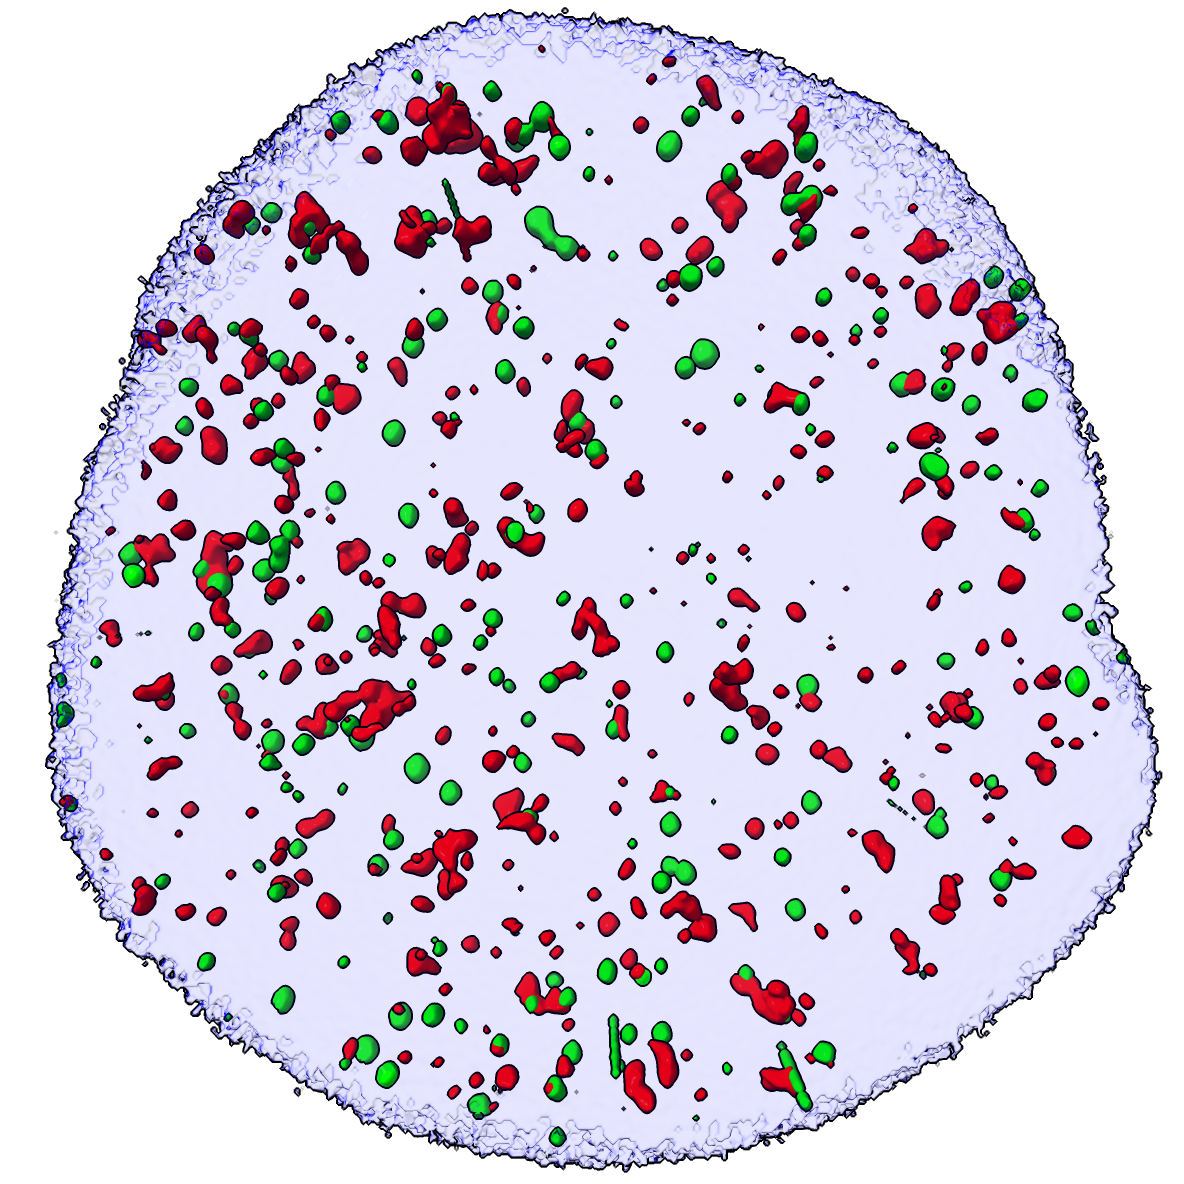
Masked | 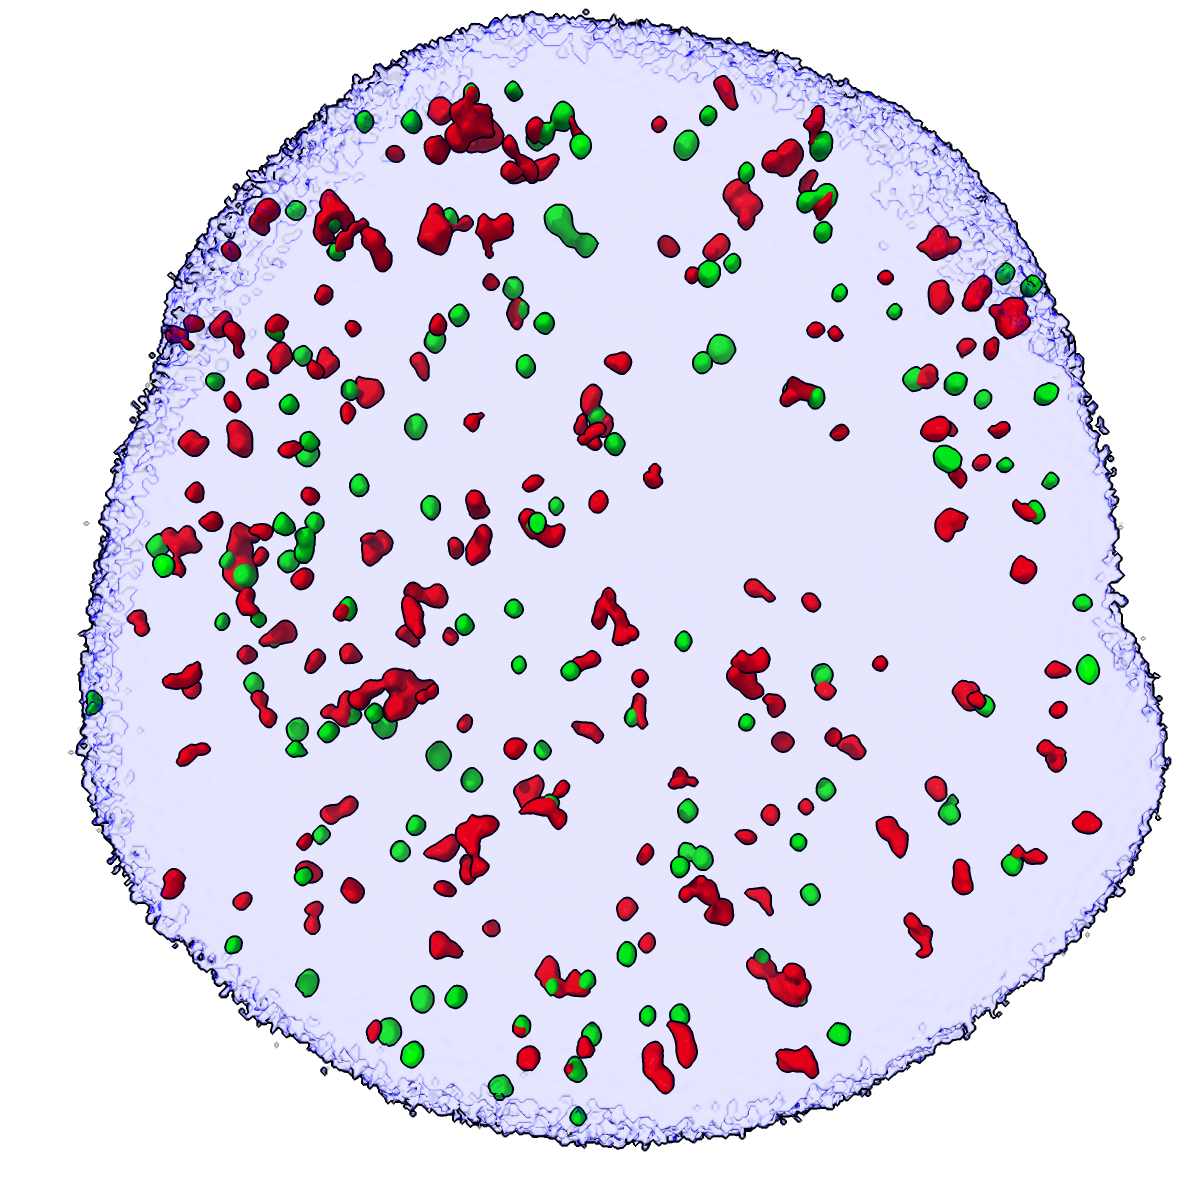
Small blobs and artifacts hidden |
We are only interested in the signals in the nucleus defined by the DAPI blue channel, so mask all three channels to the DAPI surface, creating new images #2,3,4.
volume mask #1 surface #1.3
Hide small spots having volume less than 0.01 cubic microns since we are only interested in stronger signals.
surface dust #2,3 metric volume size 0.01
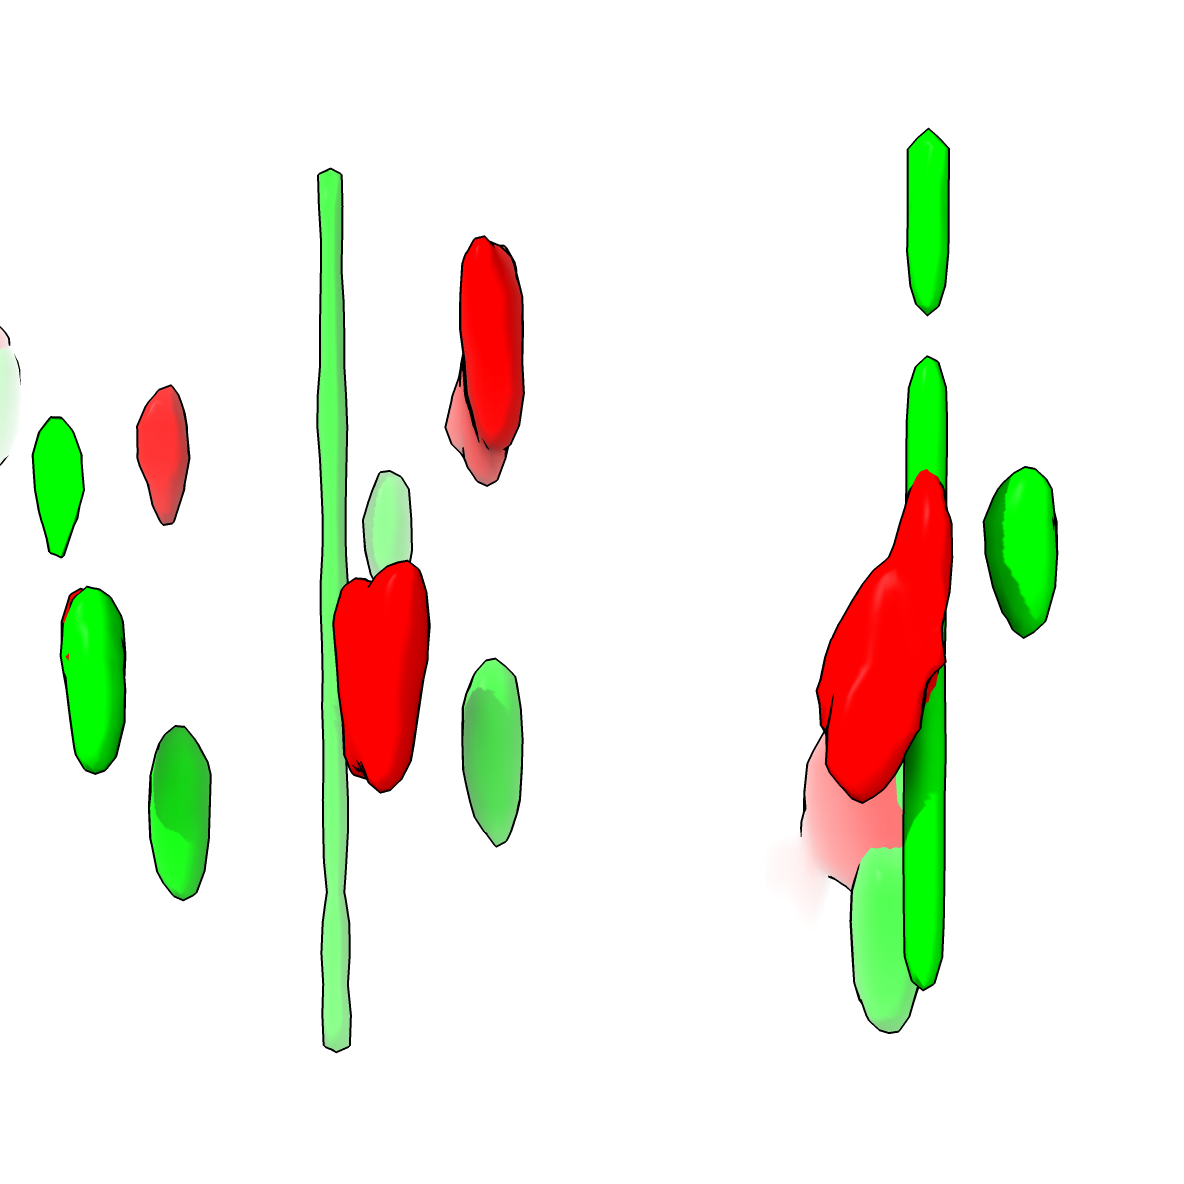
Vertical green bar artifacts |
There are some microscope artifacts that are vertical green blobs spanning the entire image, appear to be stuck camera pixels. Lets hide those. Enable the "hide blobs" mouse mode, hide the DAPI surface then click with the right mouse button the green surfaces of the artifacts to hide them.
      mouse right "hide blobs"
      hide #3 model
Colocalized |
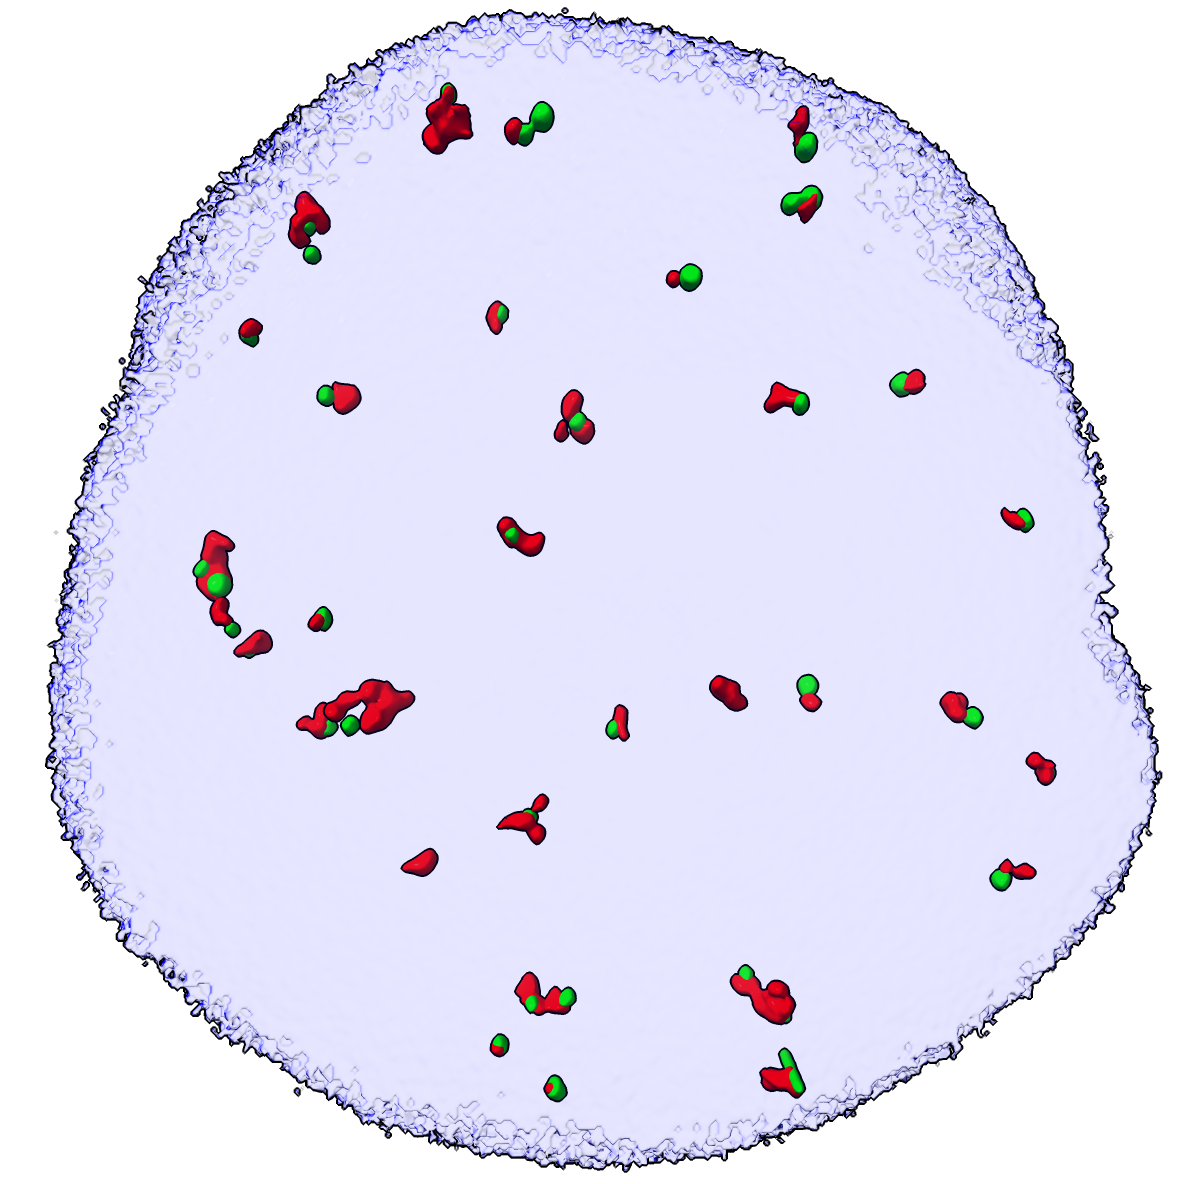
Now hide gh2ax and ligase4 spots that are not with .1 micron of each other. There are 34 gh2ax and 37 ligase4 spots in close proximity.
      surface hidefarblobs #2 near #3 distance 0.1

          Surface #2.1 has 34 near blobs, 139 far blobs, total 173
          Surface #3.1 has 37 near blobs, 91 far blobs, total 128
Only 20-30% of the spots at the threshold levels we chose colocalize. Possibly gh2ax and ligase4 are just overlapping by chance. To test this we can move the green spots to new random locations within the nucleus and see how many colocalize.
To do this we use a custom written Python script randomize.py in ChimeraX which defines a moveblobs command to randomly move the ligase4 surfaces, and a colocrand command that can do the random moves of all spots and measure the number that colocalize iterating 1000 times to get a mean and standard deviation of the number of colocalizing ligase4 spots if positions are random.
Open the randomize.py Python file in ChimeraX to define the colocrand command. Restore all the non-colocalized command using the surface dust command and mouse click to hide the artifacts. Then run the colocrand command to get statistics.
      open randomize.py
      surface dust #2,3 metric volume size 0.01
      colocrand #3 near #2 distance 0.1 mask #4 iterations 1000
          1000 iterations, near count mean 16.307, stdev 3.723
So the mean number of colocalizations with random ligase4 spot placements is 16.3 with standard deviation 3.7. In the actual experimental data we see 37 colocalized ligase4 spots. So possibly about 16 of the 37 observed colocalizations are coincidental overlap. A 95% confidence interval for the number random colocalizations is 9 to 24 (mean -/+ 2*standard deviations).

Randomly placed ligase4 spots (green) | 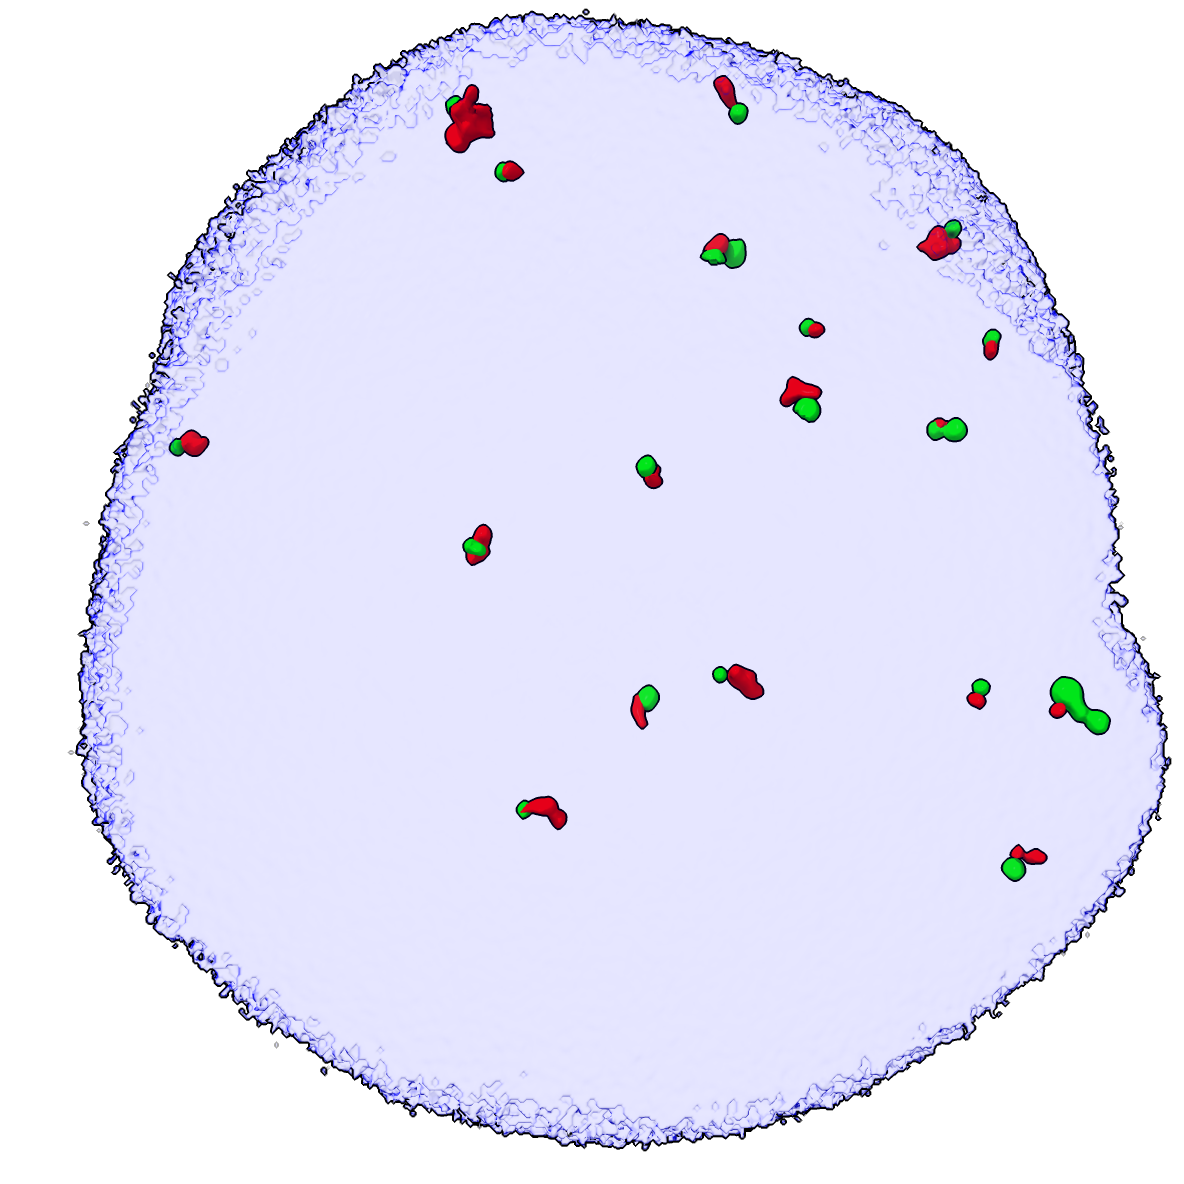
Colocalization |
To see an example of what the randomized positions and colocalization looks like we can use the moveblobs command and compute colocalization. The colocrand and moveblobs command take the DAPI map as a mask argument that assures the random ligase4 spot placements lie entirely in the nucleus (where the DAPI signal is non-zero).
      moveblobs #3 mask #4
      surface hidefarblobs #3 near #2 distance 0.1

          Surface #3.1 has 19 near blobs, 109 far blobs
          Surface #2.1 has 18 near blobs, 155 far blobs