Tom Goddard
June 10, 2024
| Note: The experimental dms command described here has been superceded by the mutationscores command. |
Here are some commands added to ChimeraX to visualize deep mutational scan data. This data consists of scores obtained from experimental assays for almost all possible mutations of every residue in a protein. The ideas here were developed with Willow Coyote-Maestas, Matt Howard, and Aashish Manglik at UCSF. We show the data by coloring atomic models, labeling residues, and showing histograms, scatter plots, and umap projections.
We will look at deep mutational scan data for a proton-sensing by G protein-coupled receptor GPR68 described in this bioRxiv preprint
Molecular basis of proton-sensing by G protein-coupled receptors
Matthew K. Howard, Nicholas Hoppe, Xi-Ping Huang, Christian B. Macdonald, Eshan Mehrota, Patrick Rockefeller Grimes, Adam Zahm, Donovan D. Trinidad, Justin English, Willow Coyote-Maestas, Aashish Manglik
Here are the scores gpr68_scores_processed.csv as a comma-separated values file and an alphafold predicted structure for the protein ClassA_ogr1_human_Active_AF_2022-08-16_GPCRdb.pdb. The first few lines of the scores showing a header of field names and lines for 3 mutations of residue alanine 122 look like this
hgvs,SE_ph55,epsilon_ph55,score_ph55,SE_ph65,epsilon_ph65,score_ph65,SE_surface,epsilon_surface,score_surface,pos,len,mutation_type,variants,is.wt
p.(A122A),0.118655667,6.98E-21,-0.153383837,0.454753988,1.11E-16,0.338088558,0.080569858,1.02E-75,-0.335911984,122,1,S,A,TRUE
p.(A122C),0.381316703,5.40E-19,-1.801114,0.919180067,2.22E-16,-0.190261006,1.127075425,4.47E-45,0.50327328,122,1,M,C,FALSE
p.(A122D),0.220801473,3.72E-50,-1.445750881,0.482410836,1.11E-16,-0.053051142,0.25624828,6.47E-70,-2.255614715,122,1,M,D,FALSE
...
Open the atomic model ClassA_ogr1_human_Active_AF_2022-08-16_GPCRdb.pdb using the ChimeraX menu entry File / Open.... Then open the scores file gpr68_scores_processed.csv. This requires a ChimeraX daily builds from June 11, 2024 or newer (it is not in ChimeraX 1.8). The ChimeraX Log will show
   Opened deep mutational scan data for 7128 mutations of 364 residues,
   assigned to 364 of 365 residues of chain /A,
   score column names score_ph55, score_ph65, score_surface.
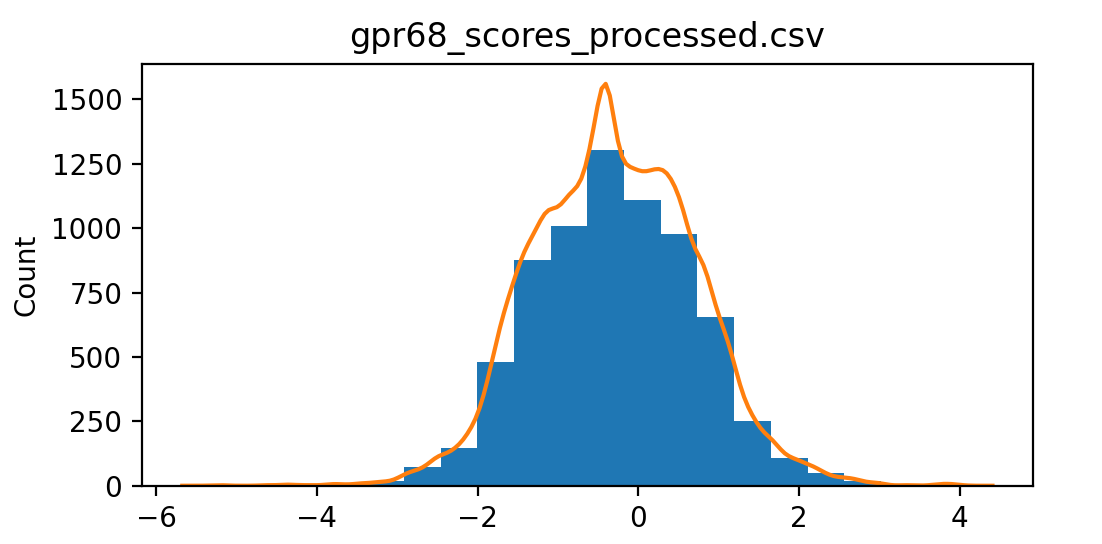
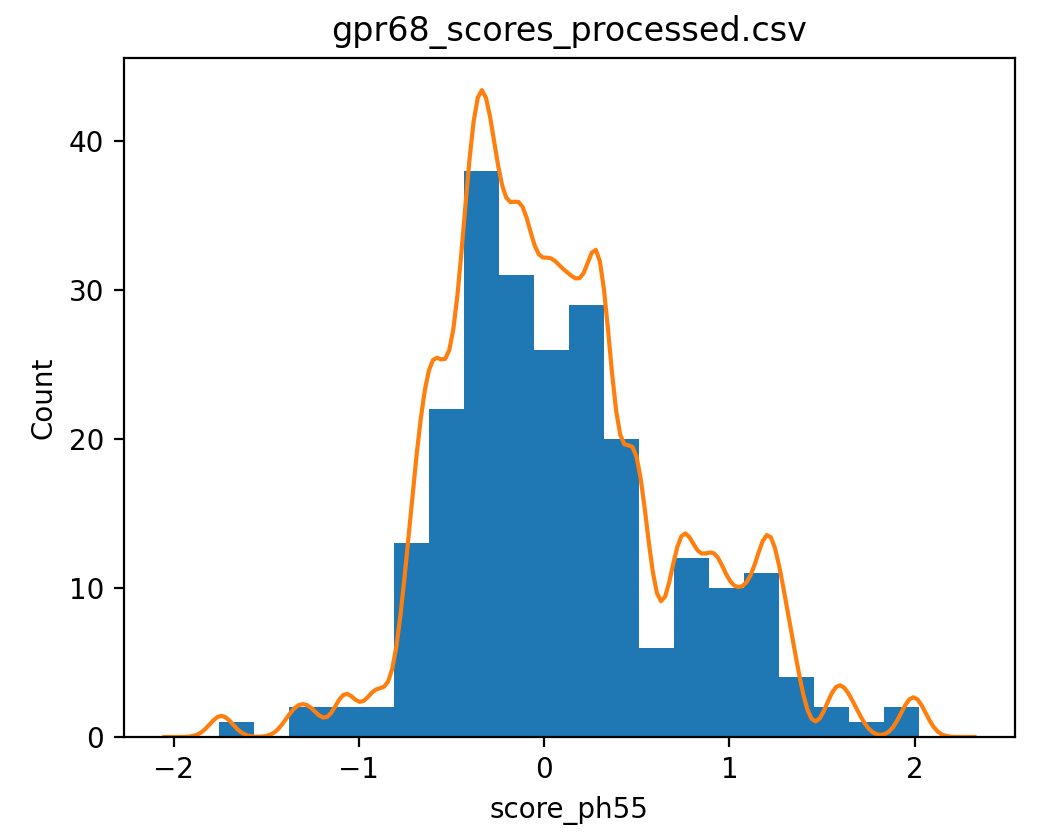
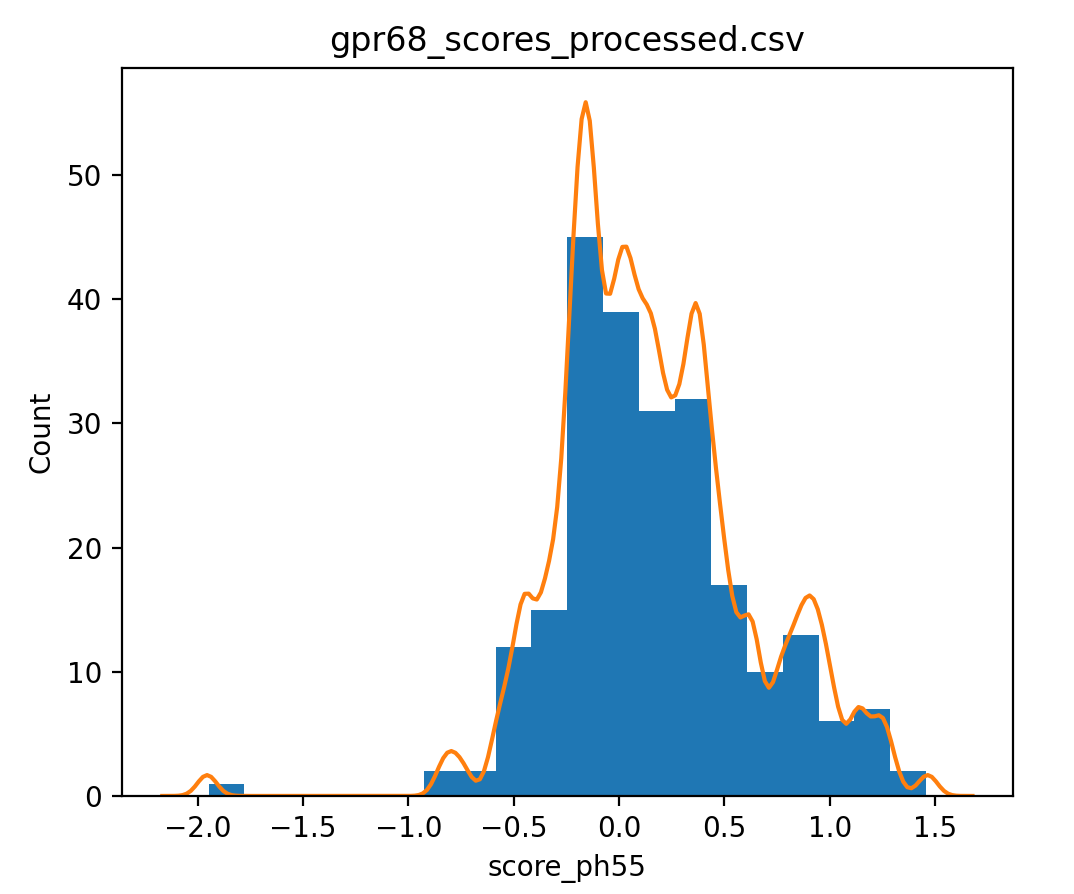
This data has 3 assays assessing GPCR function at pH 5.5 (score_ph55), at pH 6.5 (score_ph65) and how much of the protein makes it to the membrane (score_surface). To show a histogram of score_ph55 values use ChimeraX command
dms histogram /A column score_ph55
The /A indicates chain A of the atomic model. This atomic model has only one chain.
|
|
|
|
|
|
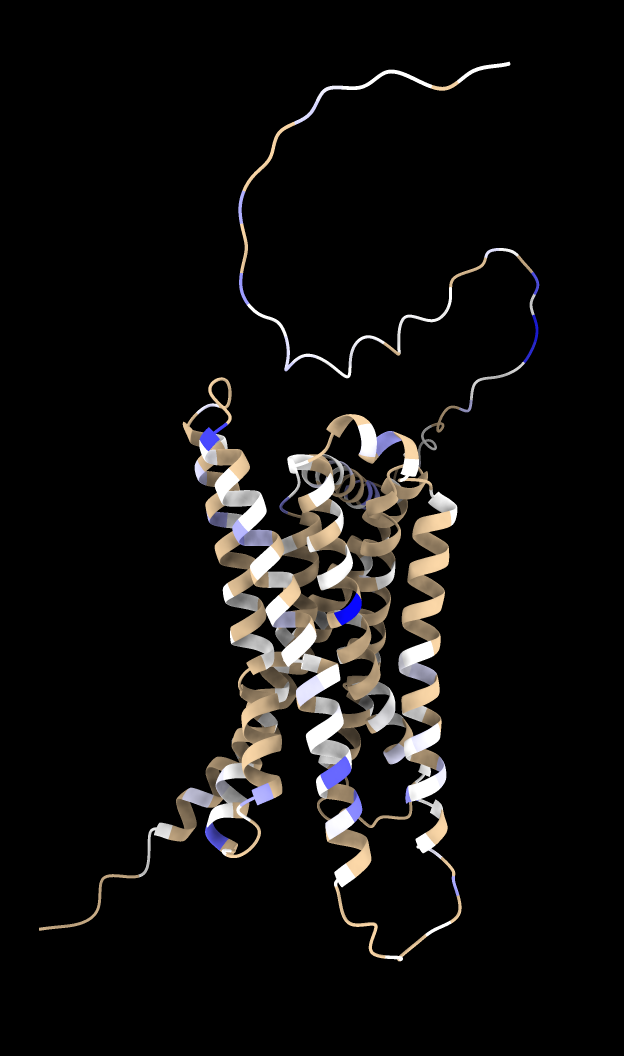
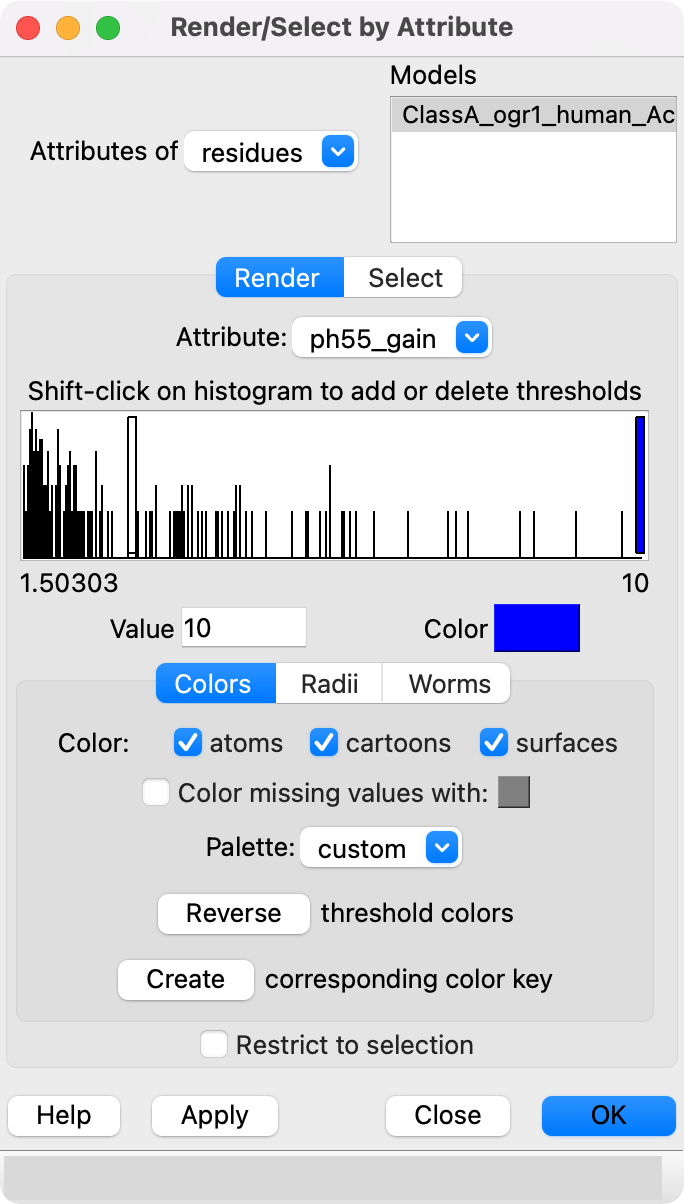
We can look at where in the protein mutations increase GPCR activity and where mutations decrease activity. The following command computes a gain in activity score for each residue by summing the scores for mutations of that residue with activity score > 1.5.
dms attribute /A column score_ph55 type sum above 1.5 name ph55_gain
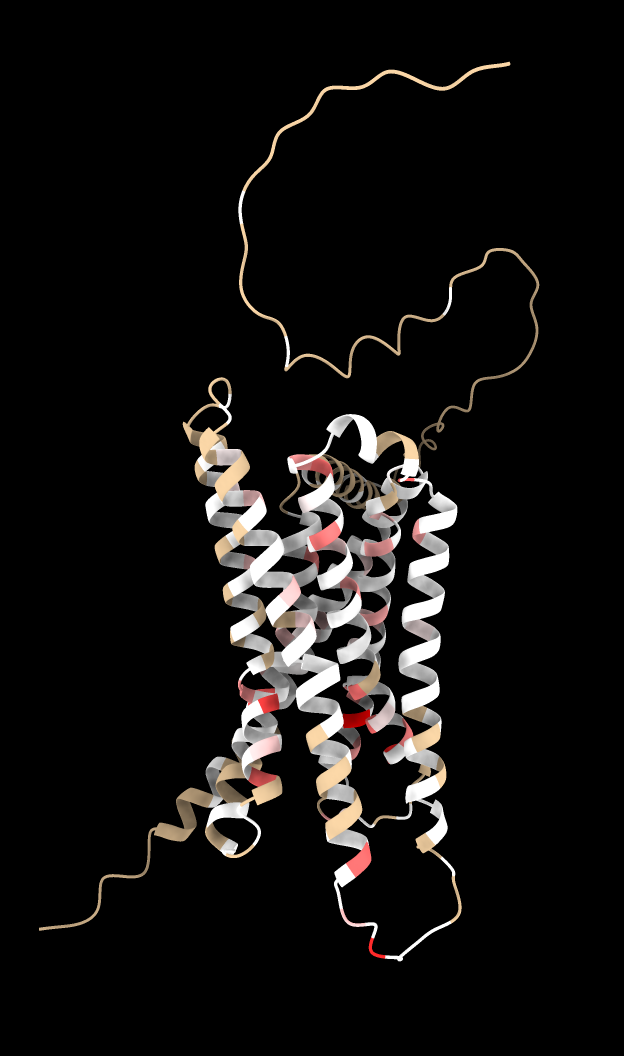
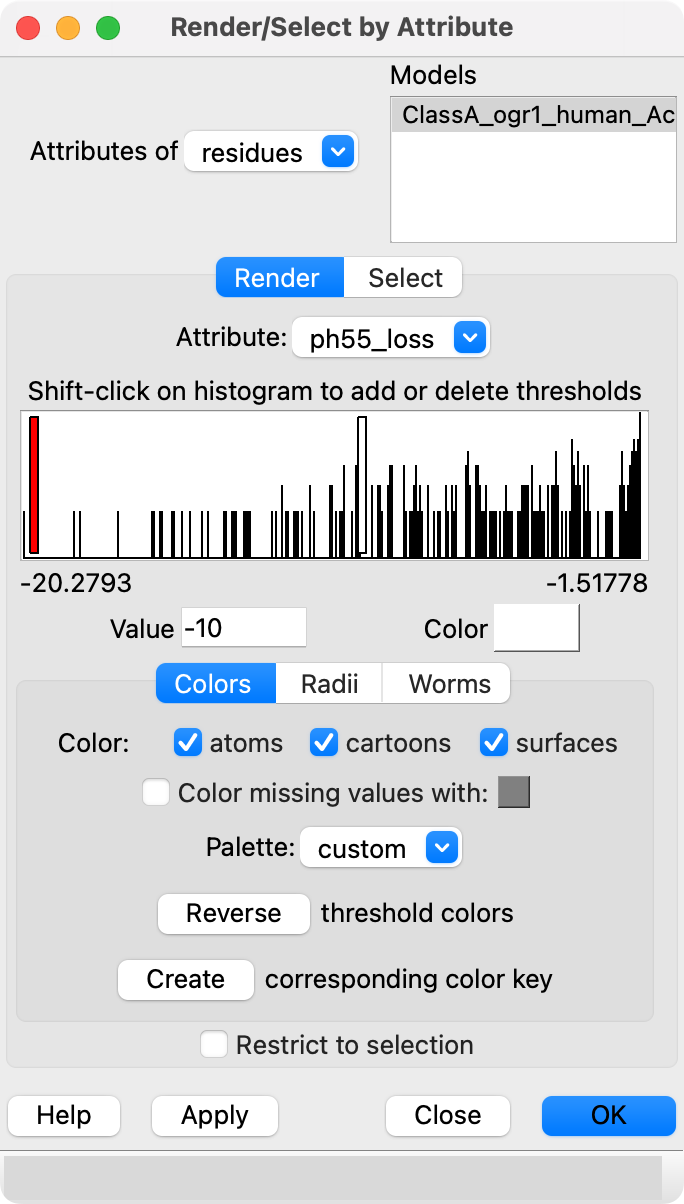
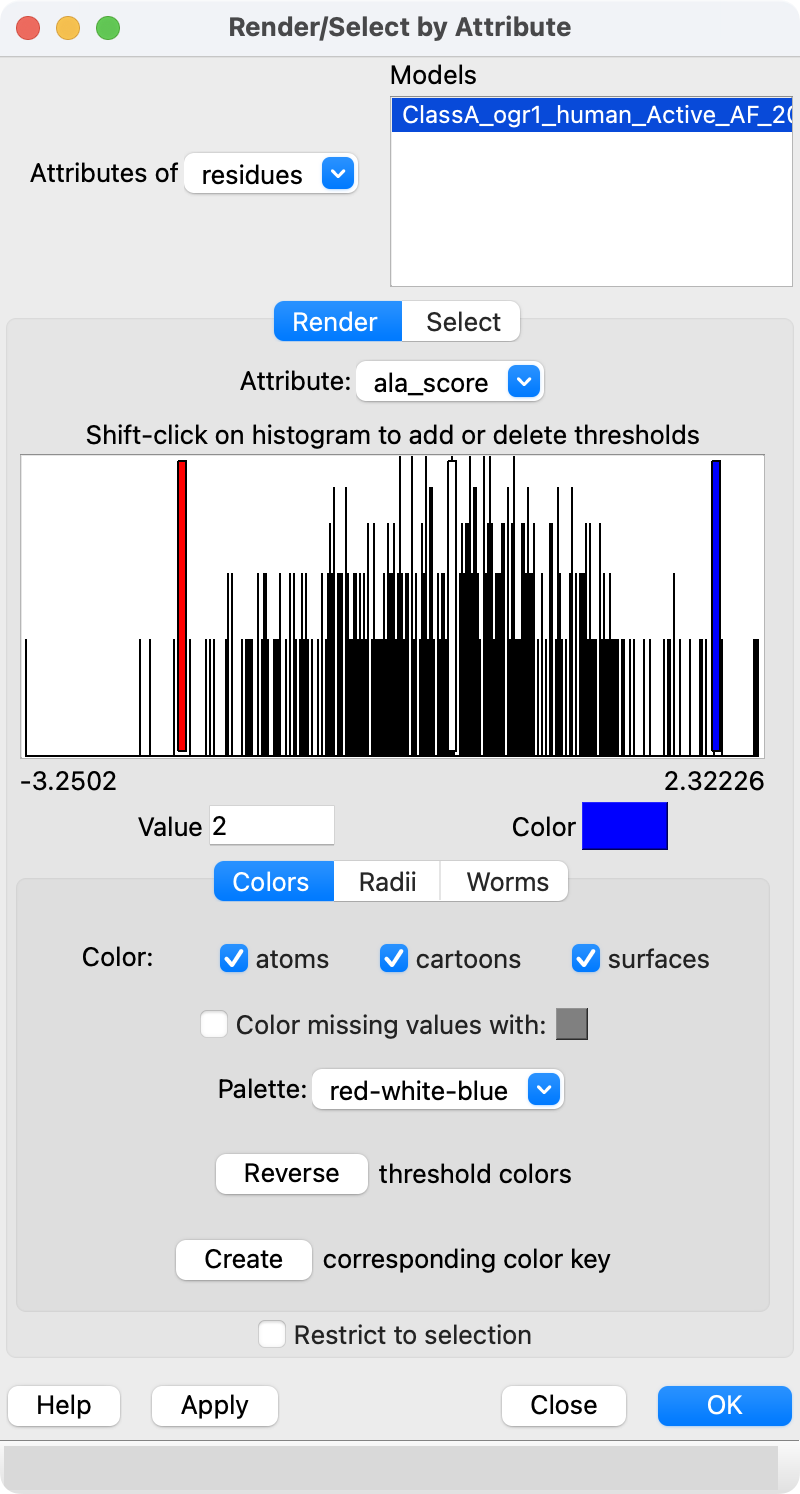
Then using the Render by Attribute panel (menu Tools / Depiction / Render or Select by Attribute) we can color blue the residues that have mutations that cause gain in activity. The brown residues have keep their color because no mutations had score > 1.5. Likewise we can compute a loss of activity score for each residue by summing the scores for mutations activity score < -1.5 and render them as red.
dms attribute /A column score_ph55 type sum below -1.5 name ph55_loss
Surprisingly the residues that have mutations that gain a lot of activity and those that have mutations that lose a lot of activity are never the same residues as we can see by trying to select the residues that have high total gain and high total loss scores.
	select ::ph55_gain>=4 & ::ph55_loss<=-10
	Nothing selected

	select ::ph55_gain>=4
	34 residues

	select ::ph55_loss<=-10
	52 residues
| 
|
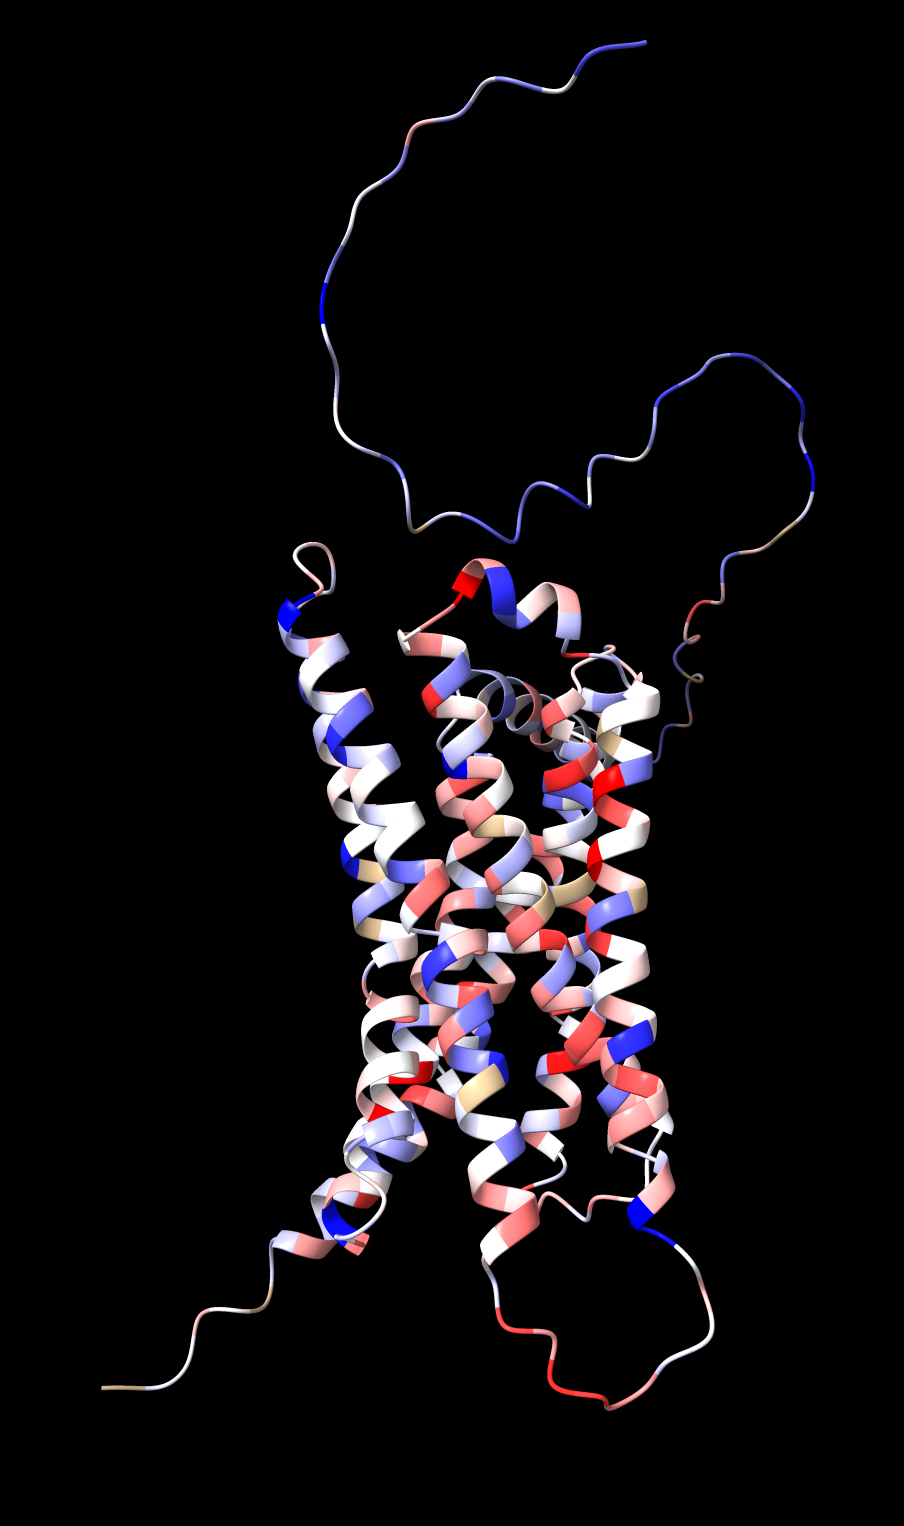
Similarly we can color all residues according to the score when mutated to alanine.
      dms attribute /A column score_ph55 type ala name ala_score
      color byattribute r:ala_score palette -2.0,red:0,white:2.0,blue
Using the dms attribute command with with any of the standard twenty 3-letter amino acid codes was added to ChimeraX daily builds dated July 3, 2024 and later.
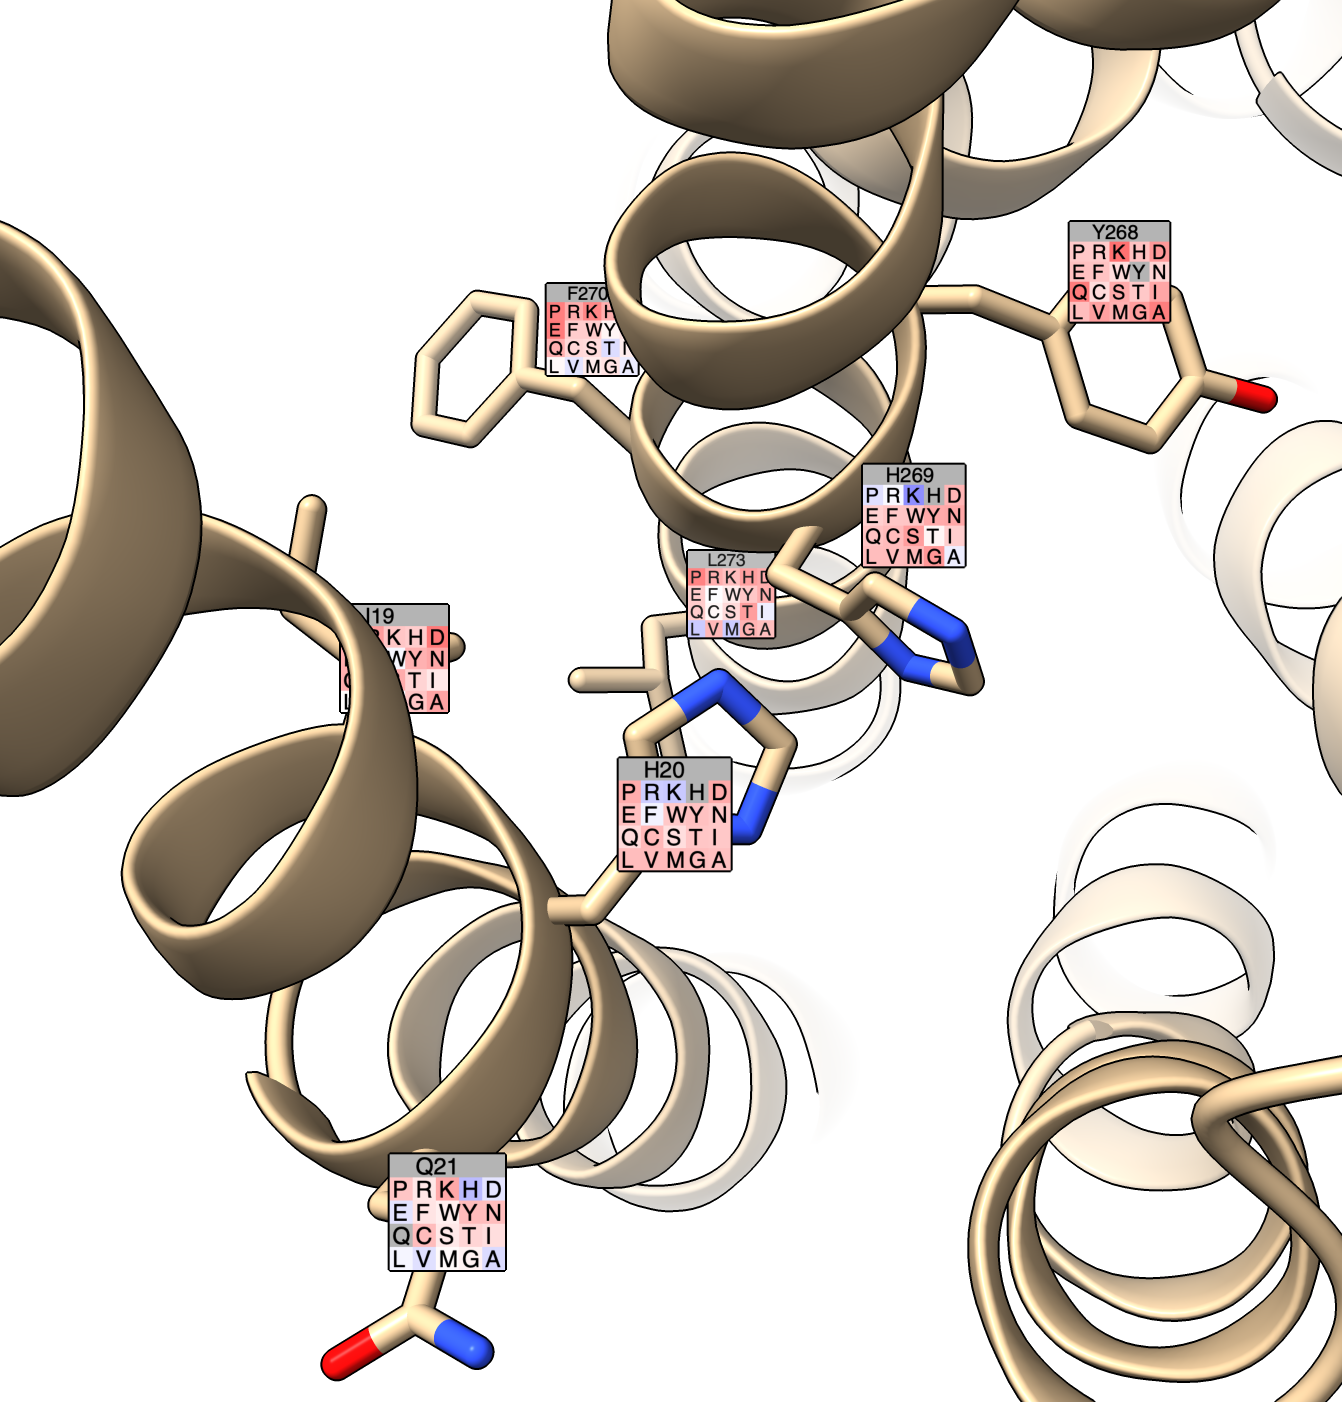
To show the mutation scores on the atomic model we can create a label for each residue with 20 colored squares showing the activity change for the 20 possible amino acids at that position with red indicating loss of activity and blue gain of activity. Residues H269, H20, E174 and Y102 are known to be important in GPR68 activity. To show labels and side chain atoms for the residues within 3 Angstroms of the two histidines use ChimeraX command:
      dms label /A:269,20 :< 3 column score_ph55 range -4,4
      show /A:269,20 :< 3 atoms
Hide the labels with
label delete
| 
|
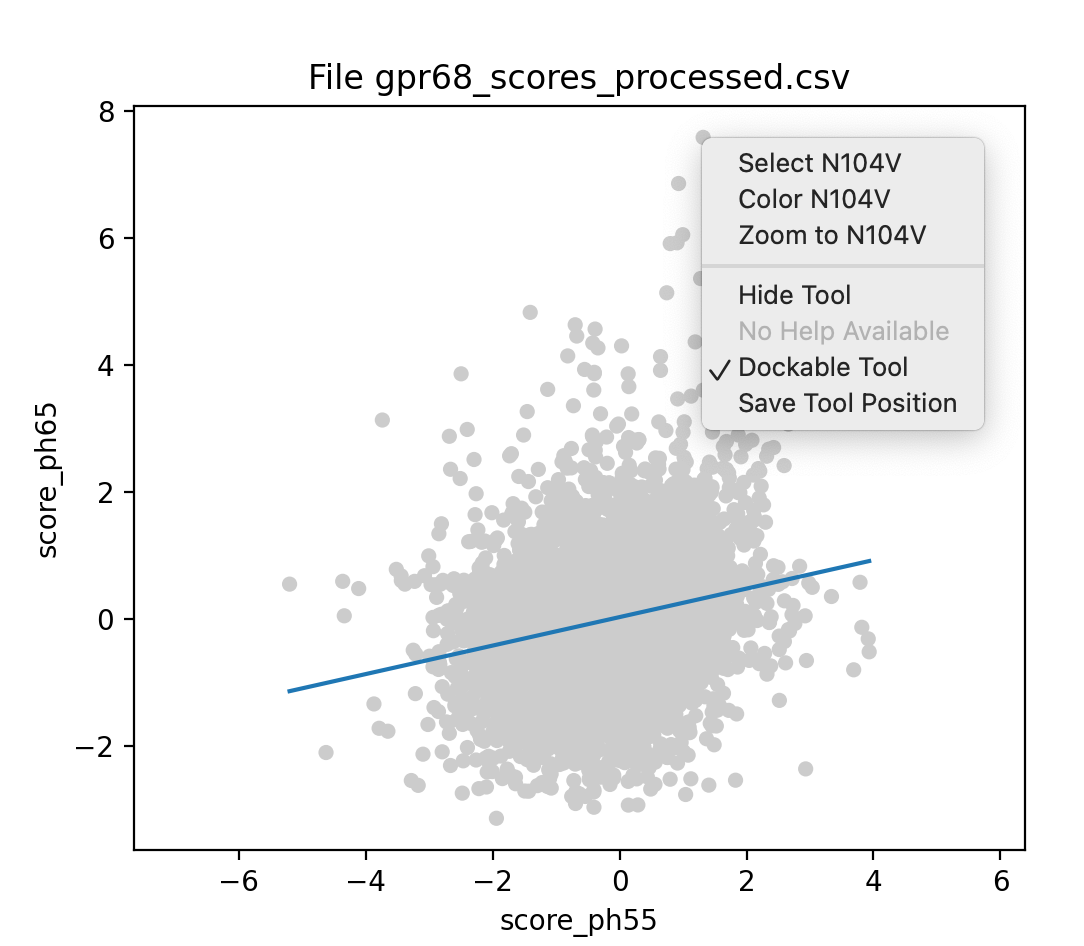
To compare the pH 5.5 activity to the pH 6.5 activity of the mutations we can make a scatter plot where each point in the plot corresponds to a specific mutation of a specific residue.
dms scatterplot /A xcolumn score_ph55 ycolumn score_ph65 correlation true
If there was no difference in activity then all the points would lie exactly on a diagonal line. As seen in the plot the pH 6.5 and pH 5.5 activity are only weakly correlated. The "correlation true" option shows a least squares fit of the points, and the Log reports an R-squared value close to 0.
      Plotted 7073 mutations in chain /A with
      score_ph55 on x-axis and score_ph65 on y-axis,
      least squares fit slope 0.225, intercept 0.0311, R squared 0.0564
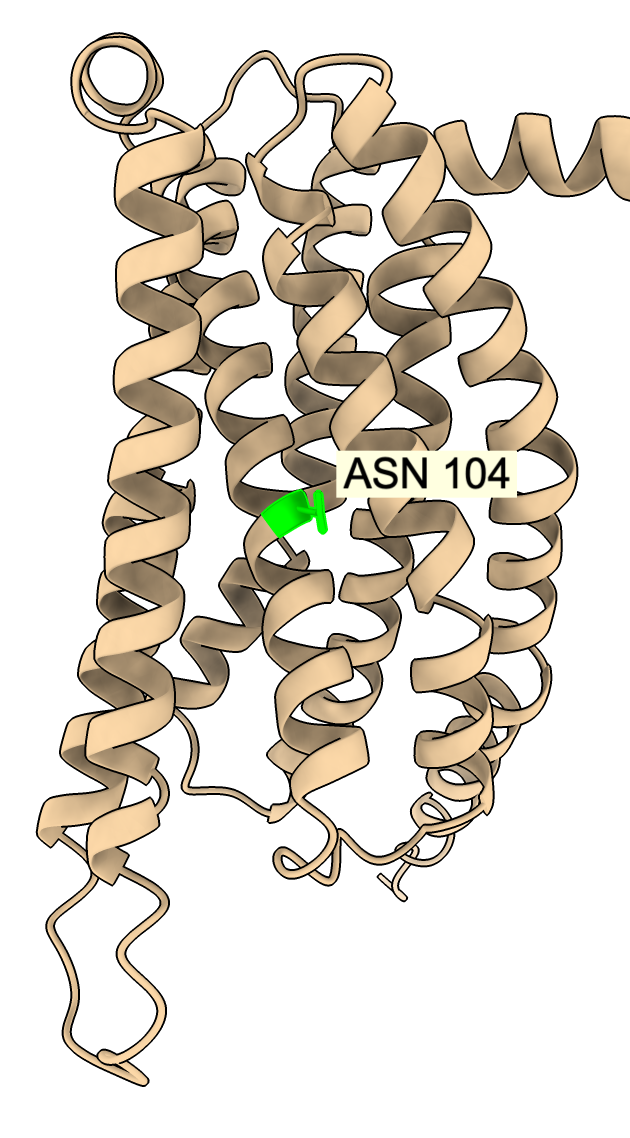
Clicking on any point in the plot brings up a menu identifying the mutation and allowing coloring, selecting (green outline), or zooming on the residue in the atomic structure. For example mutation N104V has very high activity at pH 6.5 (score 8), but modest activity at pH 5.5 (score 1).
The deep mutational scan data contains synonymous mutations where the DNA triplet changed but the amino acid remains the same. To show a histogram of just the synonymous mutation scores use:
dms histogram /A column score_ph55 type synonymous
To measure the mean and standard deviation of the synonymous scores and all mutation scores use
      dms statistics /A column score_ph55 type synonymous

        Column score_ph55, 234 synonymous mutations,
        mean = 0.0857, standard deviation = 0.618,
        mean -/+ 2*SD = -1.15 to 1.32

      dms statistics /A column score_ph55 type all

        Column score_ph55, 7092 all mutations,
        mean = -0.298, standard deviation = 1,
        mean -/+ 2*SD = -2.3 to 1.7
Non-synonymous mutations tend to decrease GPR68 activity when compared to synonymous mutations.
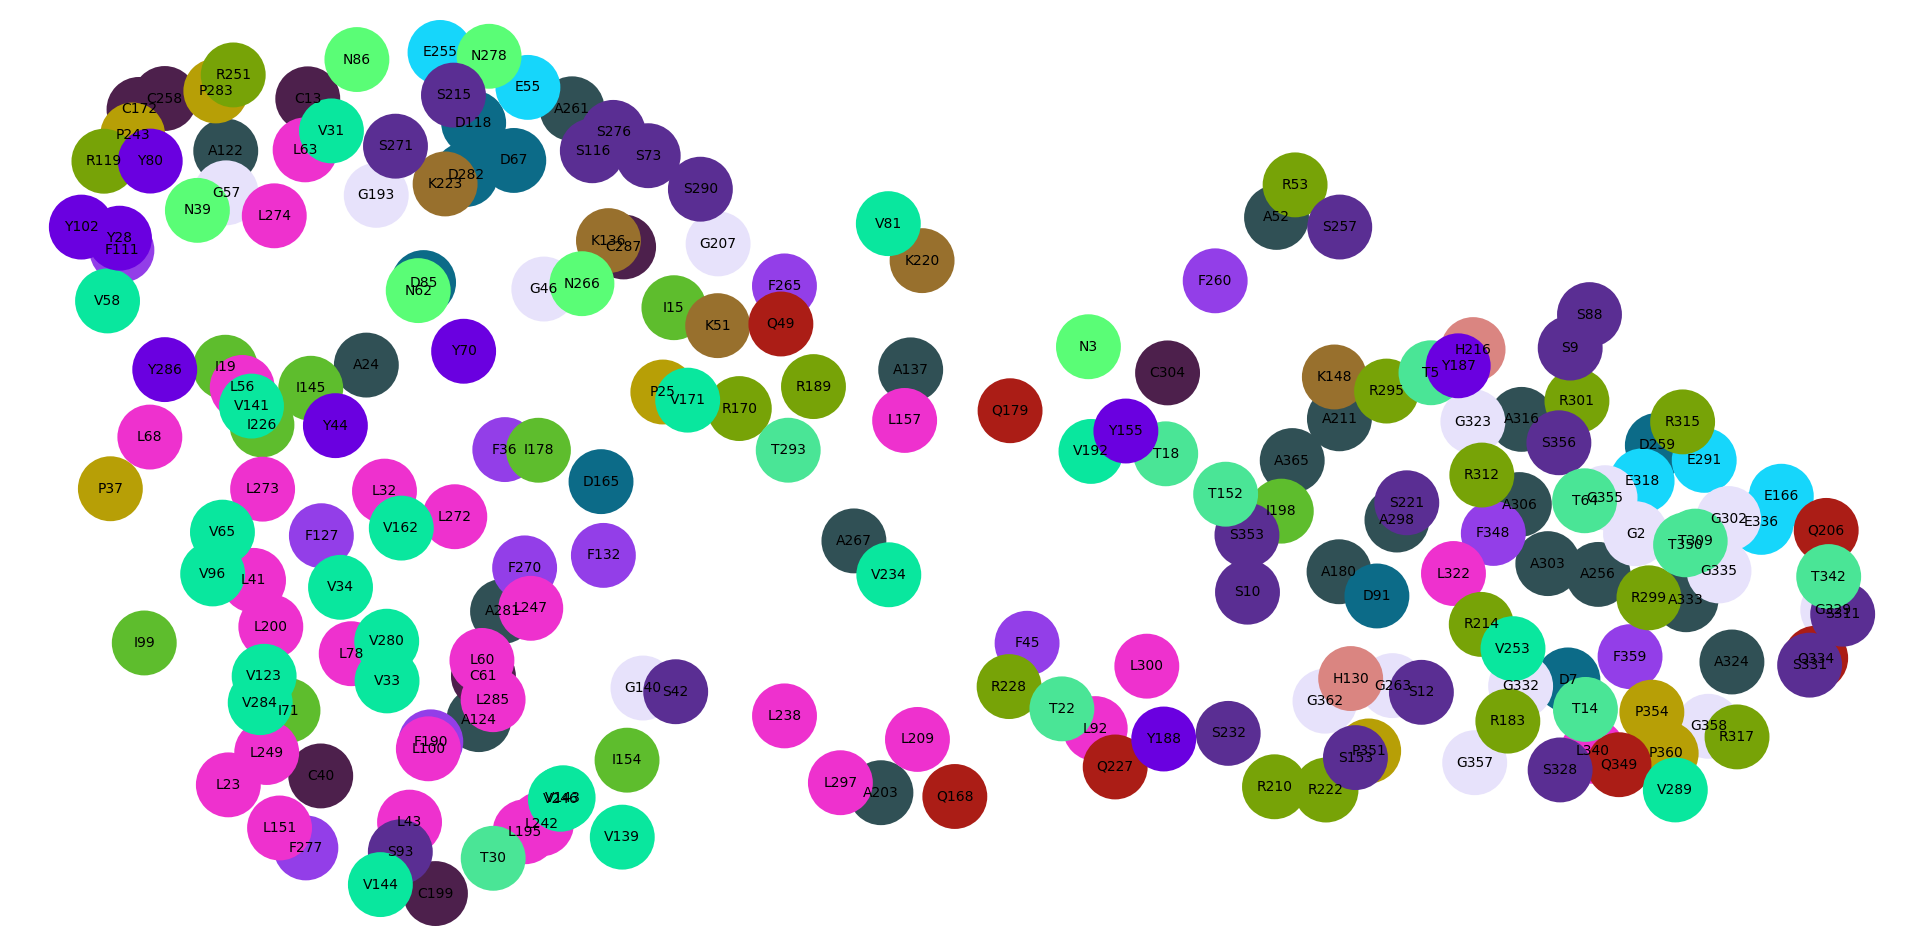
Are there patterns in how the activity varies across the 20 mutations of a residue? For instance changing a hydrophobic residue to a hydrophillic one may more often than not reduce activity. To look for such patterns we can think of the activity scores for a residue as a 20 element vector and project it to two dimensions using UMAP, uniform manifold approximation and projection, to see if there are clusters representing patterns of activity variation.
      dms umap /A column score_ph55

            211 of 364 have 20 mutations
The command currently colors the 20 different amino acids in 20 randomly chosen colors to help see if a specific amino acid type clusters in the plot.
Clusters are not evident. The GPR68 deep scan data has all 20 mutations for about 60% of the residues so only those 211 residues are plotted. It is possible that there are many patterns (e.g. 20 amino acid types times 5 patterns of activity variation per amino acid type = 100 different patterns) so we don't have enough data to reveal the clusters.
In the GPR68 cell assays reduced expression on the membrane of the protein reduces the pH 5.5 and 6.5 scores. We could try to correct for this by making a least squares linear fit of score_ph55 versus score_surface and assuming that line estimates the change in activity due to surface expression level we can subtract that estimate from the pH 5.5. Here is how to show a histogram with that subtraction for the synonymous mutations.
dms histogram /A column score_ph55 type synonymous subtractFit score_surface
It might be reasonable to suspect that the synonymous mutation activity variation is due to variation of surface expression levels.
      dms statistics /A column score_ph55 type synonymous subtractFit score_surface

        Column score_ph55, 234 synonymous mutations,
        mean = 0.164, standard deviation = 0.459,
        mean -/+ 2*SD = -0.754 to 1.08
We see the standard deviation of the corrected activity scores is 0.459 which is less than for the uncorrected activity 0.618 (shown above in the Mean and standard deviation section).
To see all the options of the dms (deep mutational scan) commands use the "usage" command:
      usage dms

        Subcommands are:
          dms attribute
          dms histogram
          dms label
          dms scatterplot
          dms statistics
          dms umap

      usage dms histogram

        dms histogram chain columnName a text string
                         [subtractFit a text string] [bins an integer]
                         [curve true or false] [smoothWidth a number]
                         [type type] [above a number] [below a number]
                         [replace true or false]
          - Show histogram of deep mutational scan scores
          type: one of all_mutations, sum, sum_absolute, or synonymous
When running commands they can be abbreviated, for example
dms hist /A col score_ph55 type syn sub score_surface
Column names currently have to fully spelled out in the commands.
The dms commands are a very preliminary effort to allow looking at deep mutational scan data together with atomic models. So there are countless additional things to try.