
Tom Goddard
July 24, 2024
| Note: More details about ChimeraX Foldseek structure comparison can be found on the page describing ChimeraX similar structures analysis. |
This is introduction to a new structure similarity search called Foldseek in ChimeraX. Foldseek can search the PDB or AlphaFold databases in seconds finding up to 1000 similar structures, including ones with low sequence identity. I'll show how to run a Foldseek search and several ways to look at the Foldseek results. These Foldseek features are in ChimeraX daily builds newer than July 24, 2024. They are not in ChimeraX 1.8. In daily builds newer than September 12, 2024 some of the foldseek commands were renamed to similarstructures since they can also be used on MMseqs2 and BLAST search results. The Foldseek method is described in this paper
Fast and accurate protein structure search with Foldseek
Michel van Kempen, Stephanie S Kim, Charlotte Tumescheit, Milot Mirdita, Jeongjae Lee, Cameron L M Gilchrist, Johannes Soding, Martin Steinegger
Nat Biotechnol. 2024 Feb;42(2):243-246. doi: 10.1038/s41587-023-01773-0. Epub 2023 May 8.

| 
|
To search for structures matching a protein monomer that you have opened in ChimeraX use menu
Tools / Structure Analysis / Foldseek
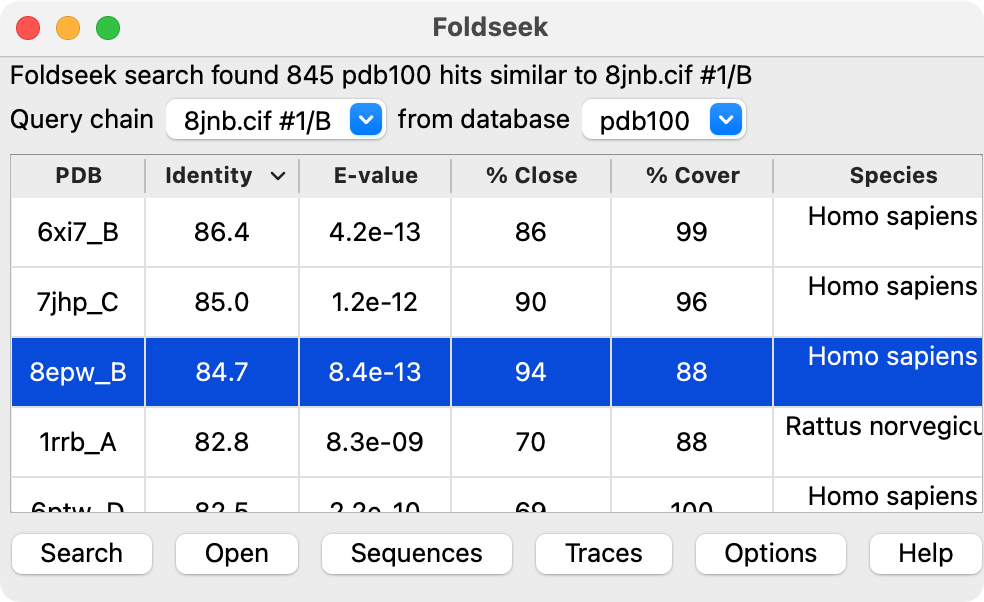
choose the query chain from the menu and the database to search (PDB or AlphaFold database) and press the Search button. This should take from 10-30 seconds to run using Martin Steinegger's Foldseek server in Korea.
Click a line or multiple lines (click and drag, or shift click) in the results table and press the Open button to fetch the corresponding structures and align them to the query structure.
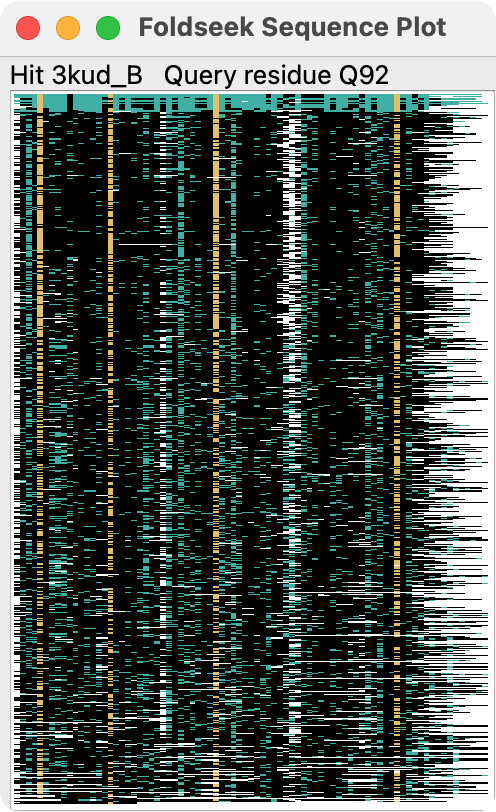 PDB 8jnb single domain | 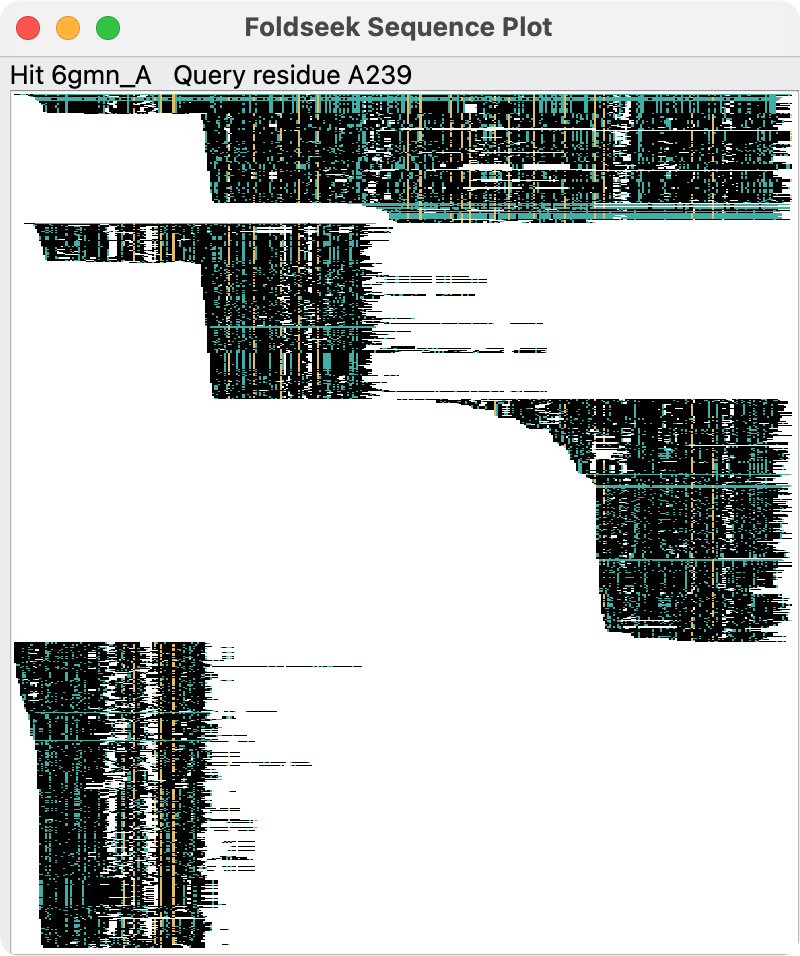 PDB 8fse four domains |
To see how the result sequences cover the query sequence, and sequence conservation press the Sequences button. This shows an image where each row is a single sequence with one pixel for each residue in the row. Blue pixels are identical amino acids to the query, yellow are positions that are more than 50% conserved and have the conserved amino acid, black are positions with a differing amino acid, and white are gaps.
For multi-domain proteins the hit sequences will often cover only some of the domains and this can be seen in the sequence plot, for example for PDB 8fse chain A with 4 domains.
Menu | 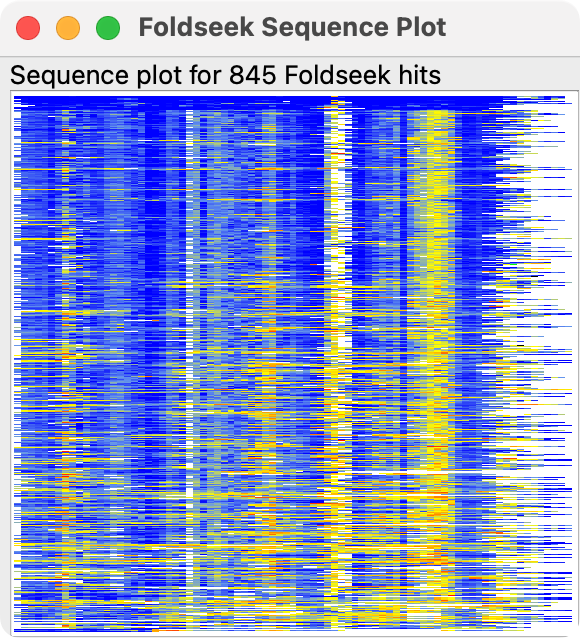
LDDT sequence coloring |
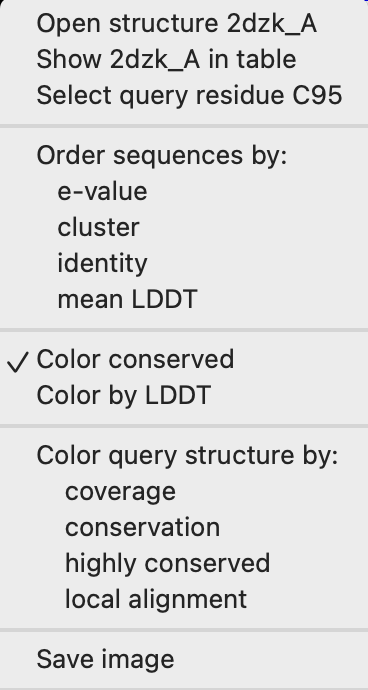
The local alignment quality can be viewed on the sequence plot by right clicking (or ctrl-clicking) on the plot to show a popup menu and choosing "Color by LDDT". LDDT stands for local distance difference test and measures whether each C-alpha atom has the same distances to nearby C-alpha atoms as in the query structure. Unchecking "Color conserved" in the menu hides the blue sequence identity and yellow 50% conserved colorings to more clearly see the LDDT. Blue indicates high LDDT (above 0.8), with 0.6 light blue, 0.4 yellow, 0.2 orange and 0 red.
Render by attribute | 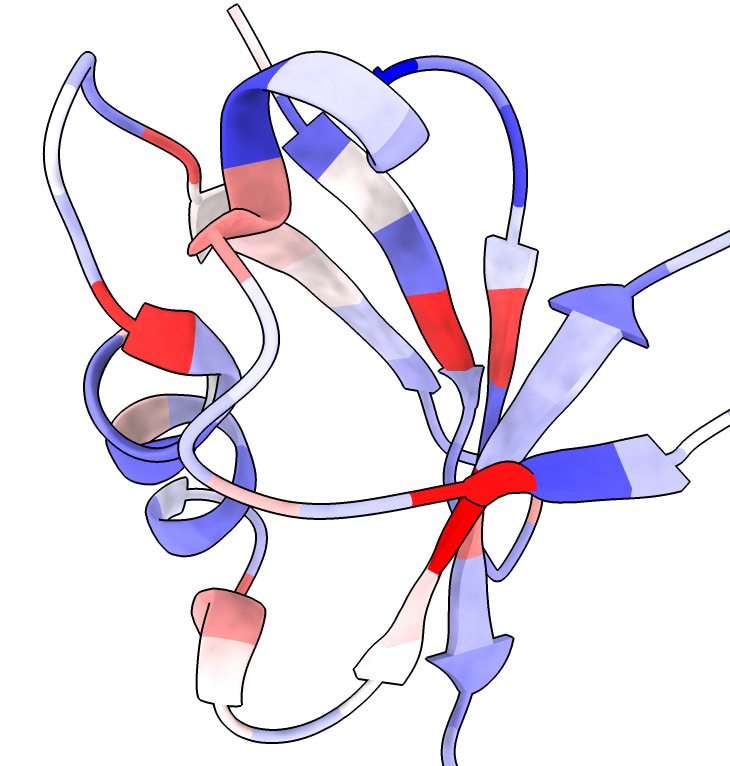
Conservation coloring | 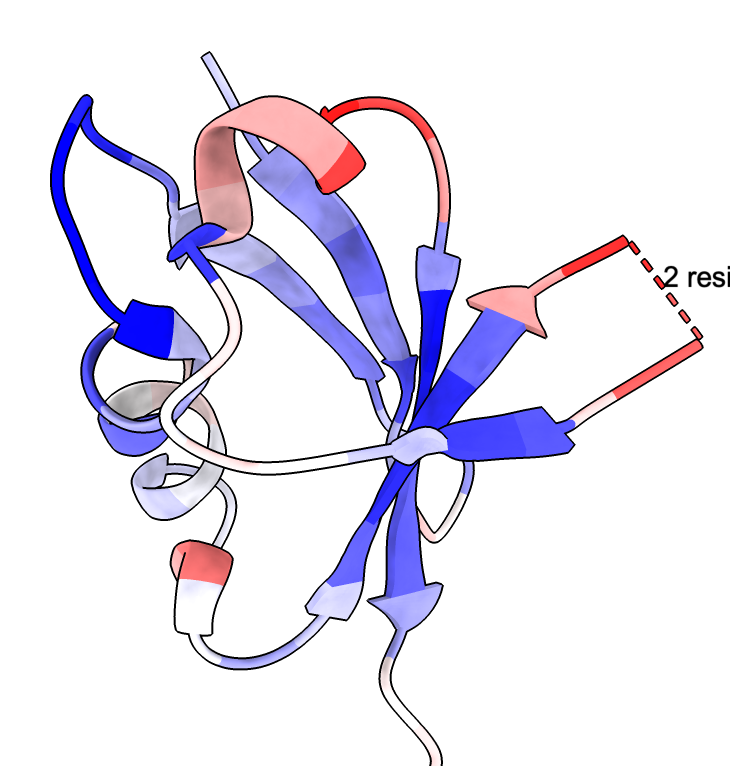
Mean LDDT coloring |
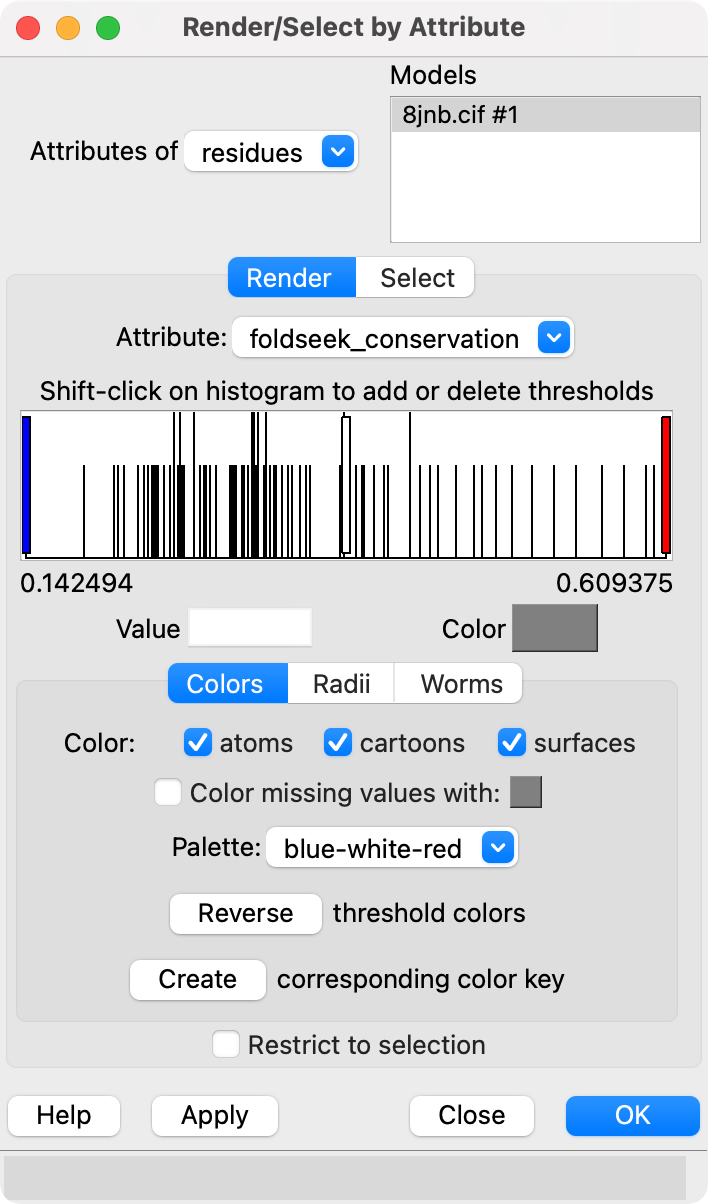
We can show conserved sequence positions by coloring the query structure using the Render by Attribute tool (menu Tools / Depiction / Render/Select by Attribute), choosing attribute of "residues" and attribute "foldseek_conservation" (renamed to just "conservation" in ChimeraX newer than September 12, 2024). This attribute is created when you display the foldseek sequences.
The conservation attribute is the percent identity of the most prevalent amino acid for each position. Another attribute foldseek_entropy gives an entropy-based conservation. The mean LDDT score at each position is the attribute foldseek_lddt. The number of hits covering each residue is the attribute foldseek_coverage.
These colorings can also be done using the context menu obtained by right click or ctrl-click on the Sequences plot. The colors scheme for coverage is red for 0 hits, white for 50% of hits covering, and blue for 100% of hits covering. For conservation the scheme is blue for 0% identity, white for 25% identity, and red for 50% identity. For highly conserved positions more than 50% conserved are red and other positions are gray. For average LDDT 0 is red, 0.2 orange, 0.4 yellow, 0.6 cornflowerblue, 0.8 blue.
These colorings can also be done by the "color byattribute" command.
      color byattribute r:foldseek_conservation #1 palette 0.2,blue:0.4,white:0.6,red
      color byattribute r:foldseek_entropy #1 palette 2,red:2.5,white:3,blue
      color byattribute r:foldseek_lddt #1 palette 0.4,red:0.6,white:0.7,blue
In ChimeraX newer than September 12, 2024 the attributes have been renamed:
      color byattribute r:conservation #1 palette 0.2,blue:0.4,white:0.6,red
      color byattribute r:entropy #1 palette 2,red:2.5,white:3,blue
      color byattribute r:lddt #1 palette 0.4,red:0.6,white:0.7,blue
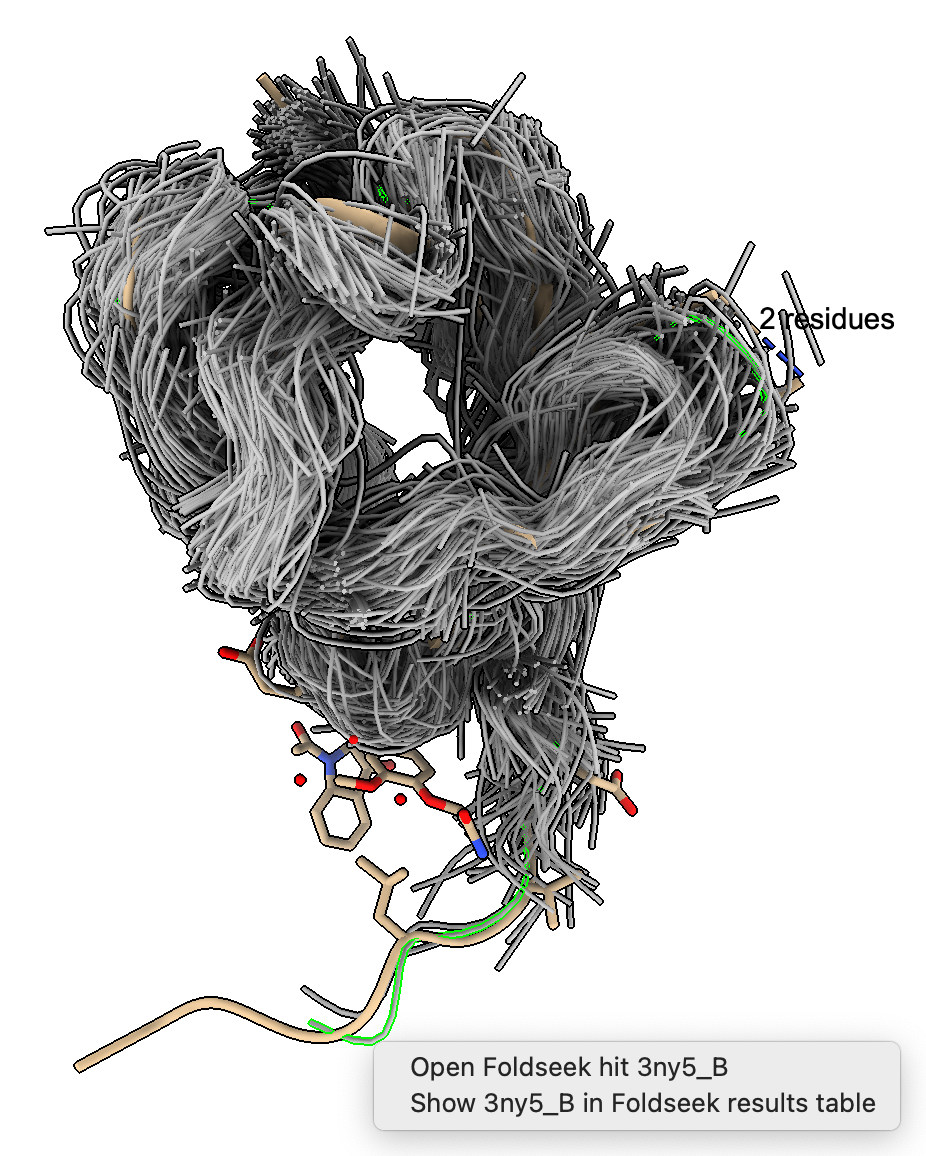
Backbone traces | 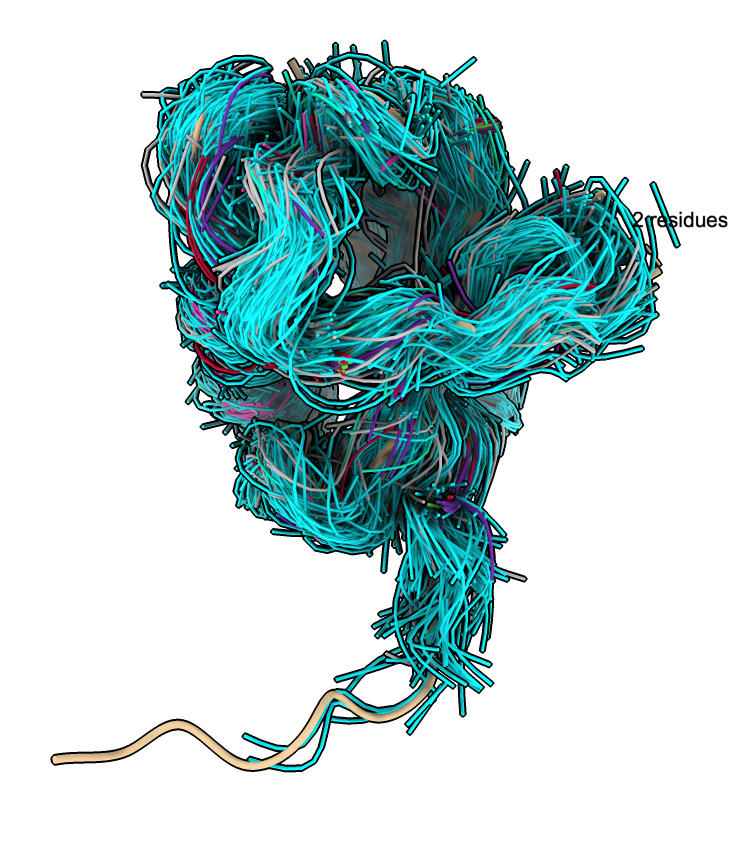
Colored by cluster | 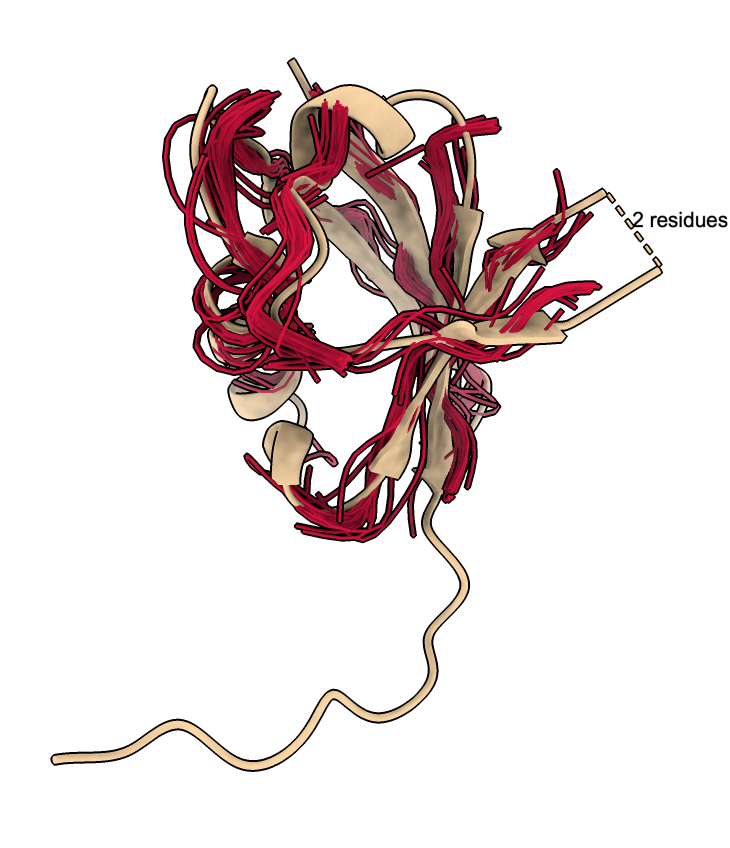
Single cluster | 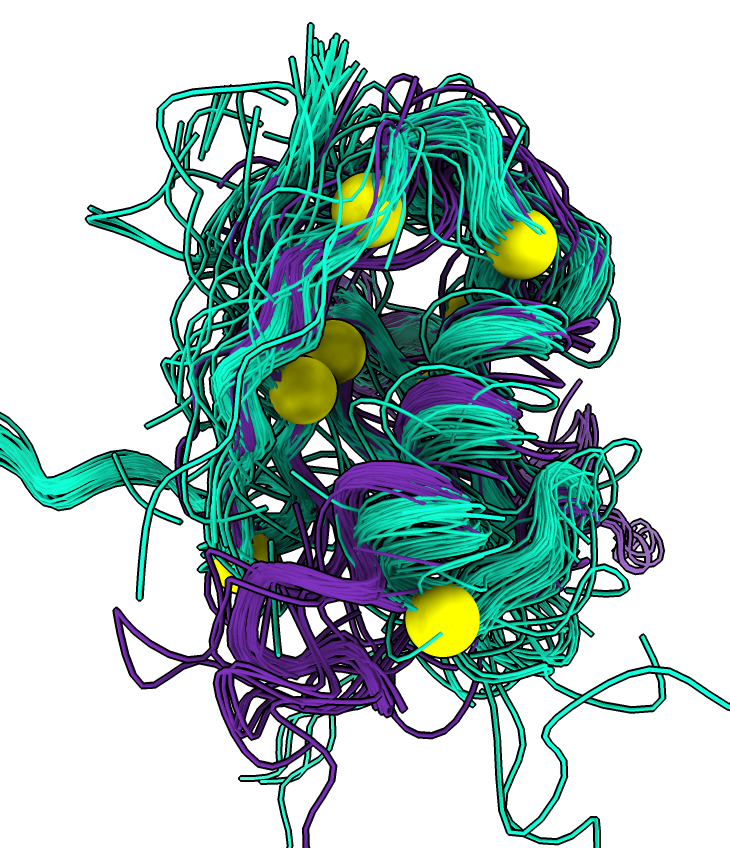
Cluster projection residues |
We can see the backbone C-alpha traces of the hits by pressing the Traces button. Each hit shows a thin tube tracing the backbone. Hovering the mouse over a trace pops up text showing which PDB structure it corresponds to. Ctrl-click on a tube will highlight it in green, and ctrl-double-click will show a popup menu where the PDB structure can be opened.
The traces can be colored using clusters described below.
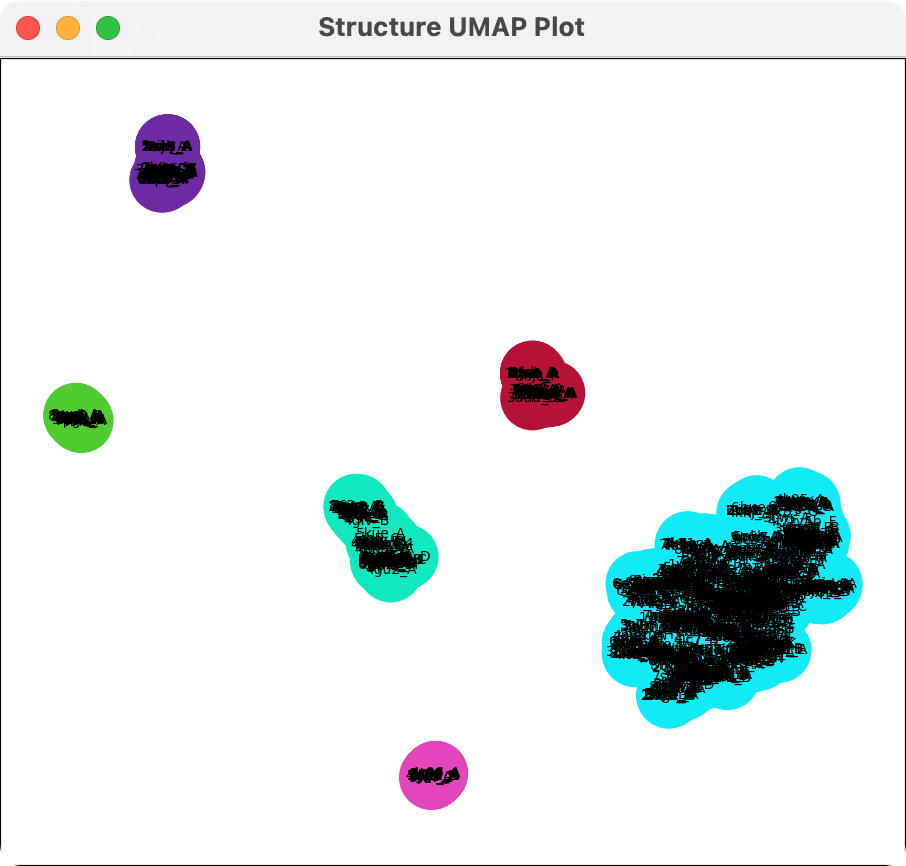
Backbone conformation clusters | 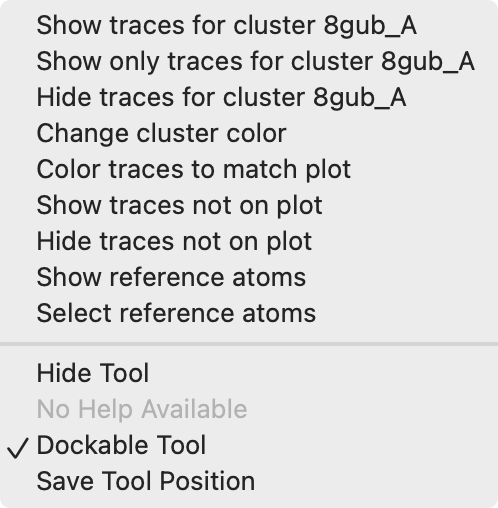
Menu on UMAP plot |
To distingish different backbone conformations among the hits use the "foldseek cluster" command. This looks at the C-alpha atom x,y,z coordinates of some residues you specify and projects them into 2 dimensions using the Uniform Manifold Approximation and Projection method (UMAP).
foldseek cluster ::foldseek_conservation >= 0.5 clusterDistance 1.5
In ChimeraX newer than September 12, 2024 this command has been renamed:
similarstructures cluster ::conservation >= 0.5 clusterDistance 1.5
Here we run it on just the sequence positions with more than 50% conservation. And we define clusters and color them using the specified cluster distance which combines structures that are within that distance in the UMAP projection.
The clusters defined by the UMAP plot can be used to color the backbone traces using the plot menu entries "Color traces to match plot", "Show only traces for cluster 8gub_A", ....
To collect all of the ligands, ions and waters from the hits aligned to the query structure use the "foldseek ligands" command. In ChimeraX newer than September 12, 2024 this command has been renamed: "similarstructures ligands". This will fetch each of the hit structures from the database and for each ligand, ion or water and use the nearby residues (within 5 Angstroms) to align to the query.
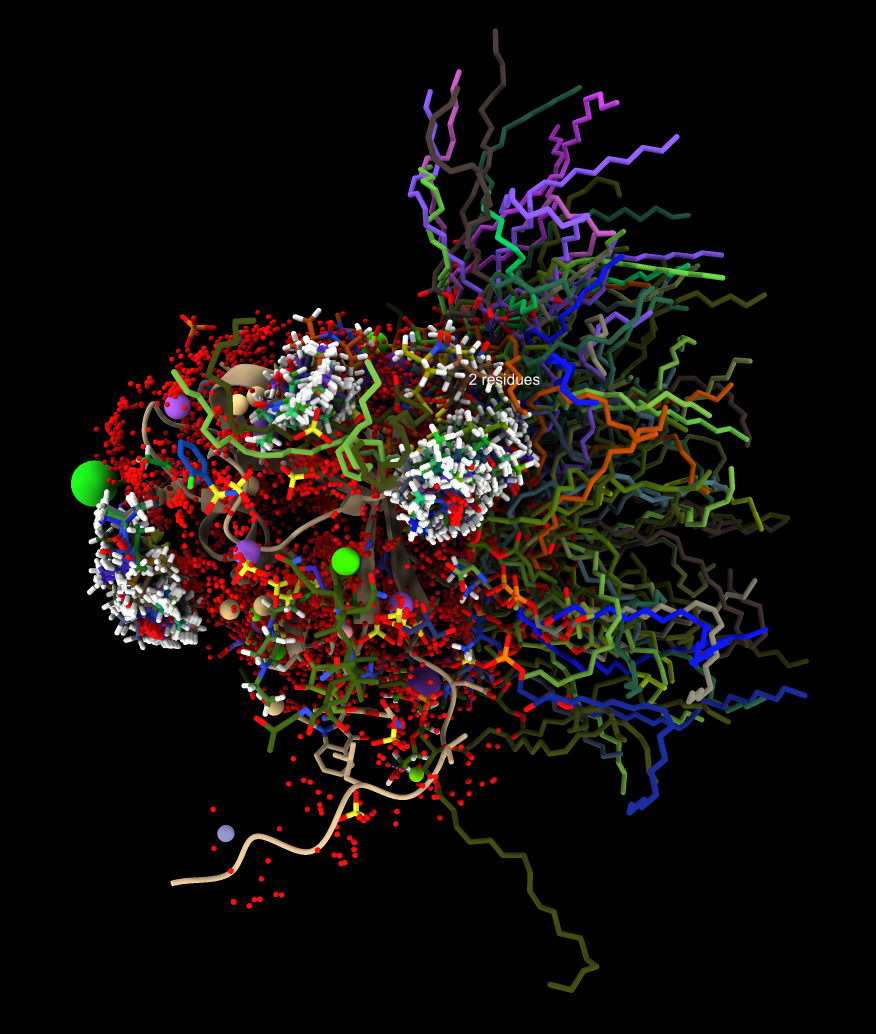
Ligands from 845 hits | 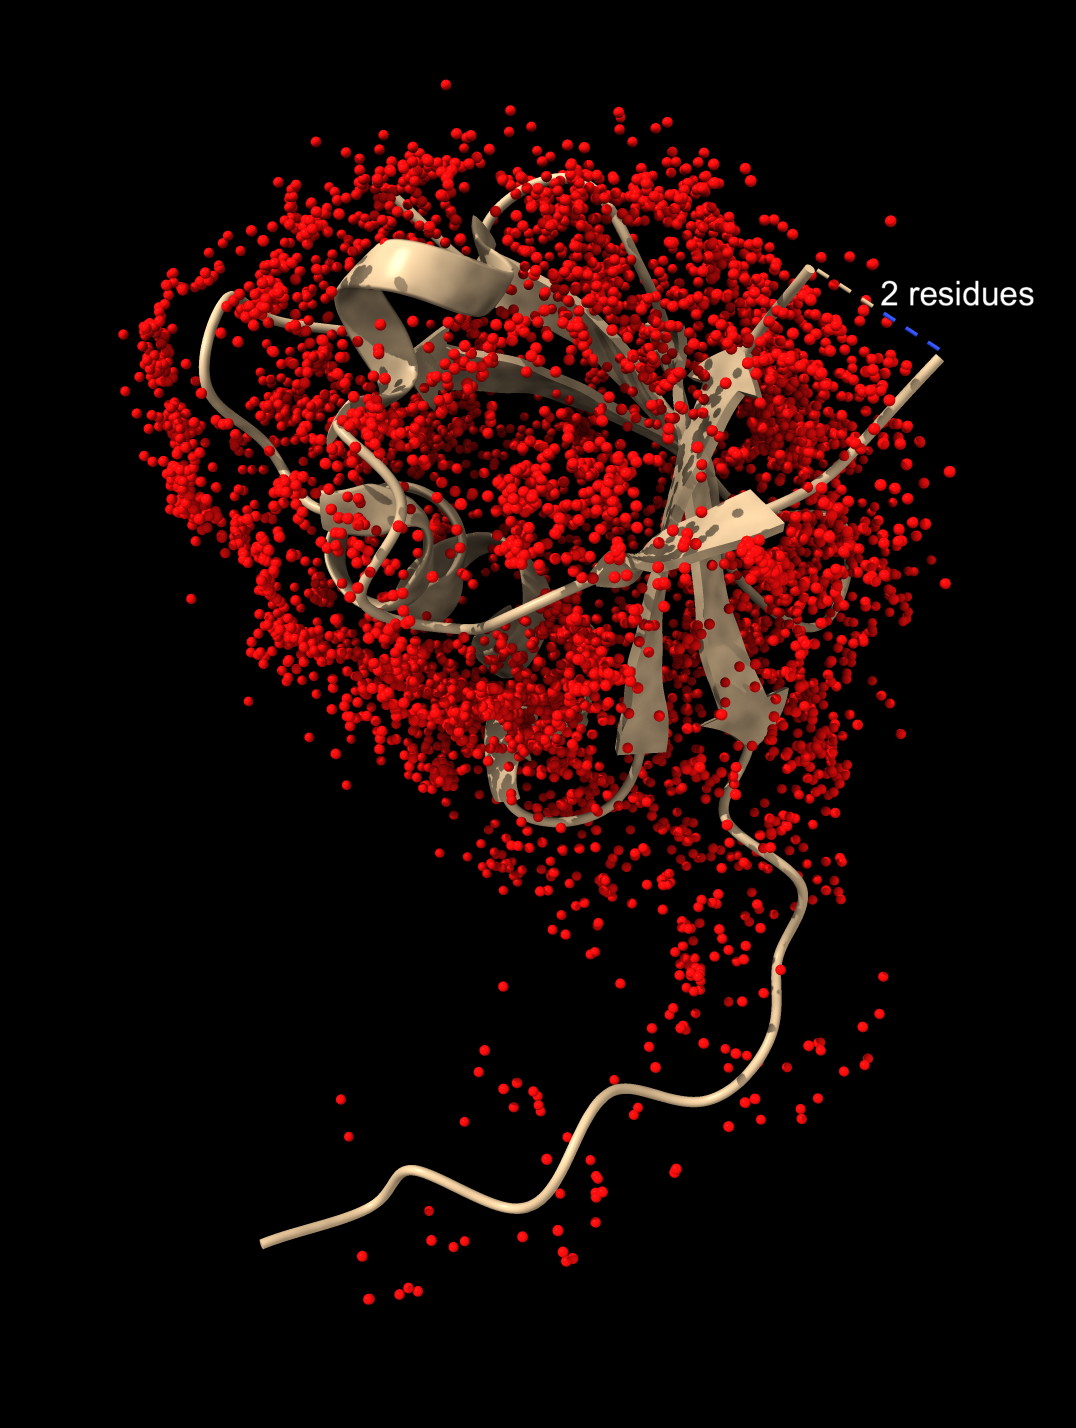
Only waters | 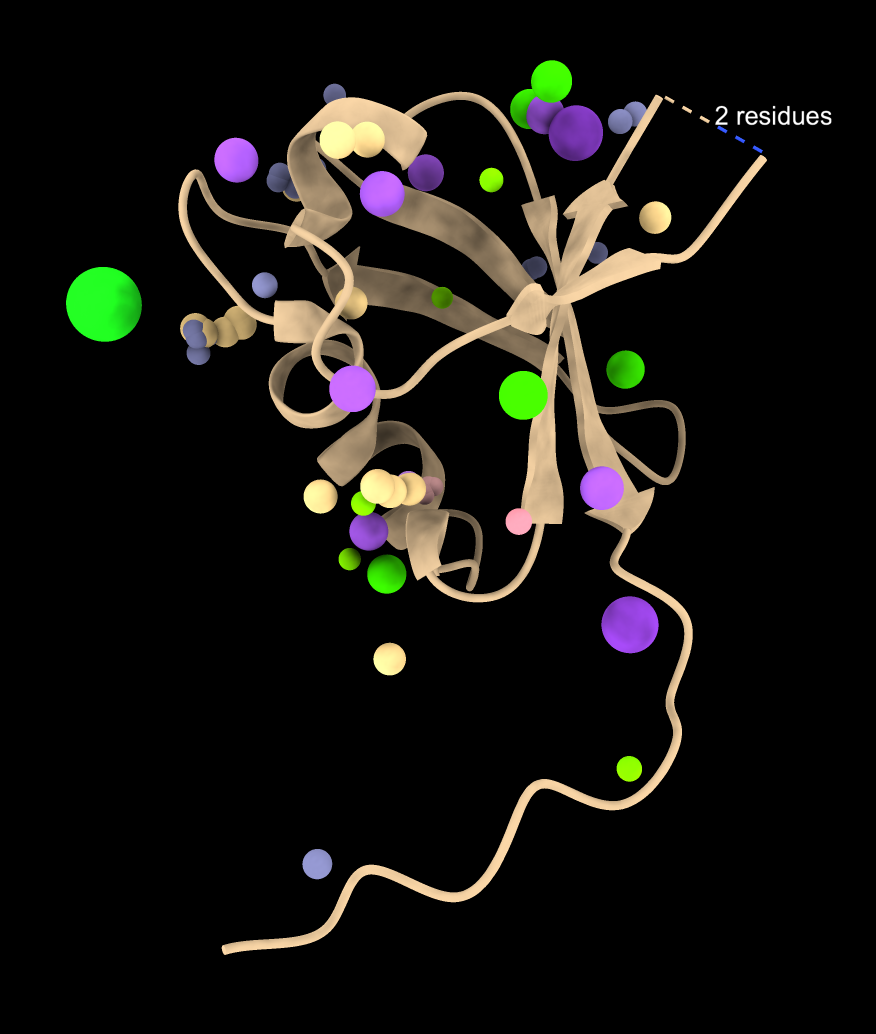
Only ions | 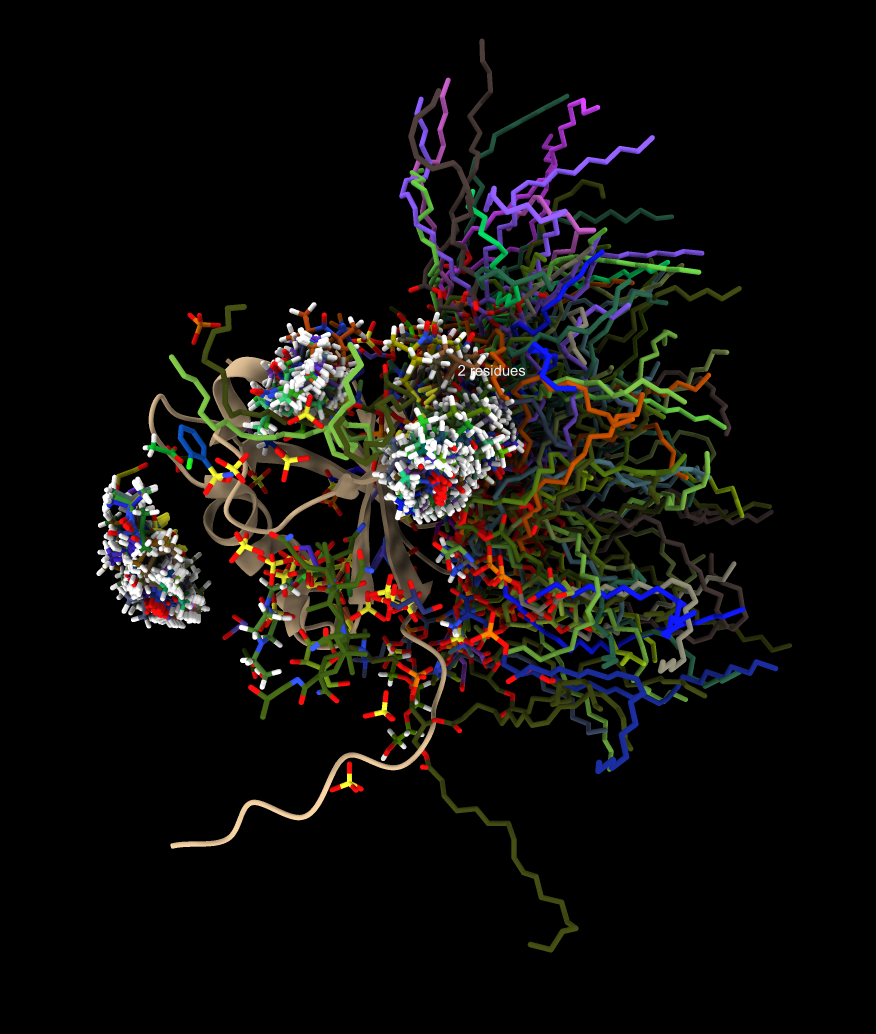
Not water or ions |
In the 8jnb example with 845 similar structures found by Foldseek, 427 of the hits had 6525 waters, 65 ions (CA, CD, CL, GA, K, MG, NA, ZN), and 246 ligands (17F, ACT, AR6, ARS, BEN, CBY, EDO, EIB, EPE, FB1, FES, FLC, GOL, IPA, MLI, MTN, NAG, NO3, PCW, PGE, PO4, RIB, SO4, SY8, TRS) that could be aligned to the query. Here is a file ligands.cif containing all of thes docked molecules. Analyzing all 845 hits is time consuming and took 75 seconds on a 2024 Mac Studio. That time does not include the PDB download time of about 5 minutes on a fast (100 Mbit/sec) network connection. The downloaded PDB files are cached on the local computer in ~/Downloads/ChimeraX/PDB so that time is only incurred once. A combined structure with all docked small molecules is created and can be saved, and hovering over any small molecule shows the PDB structure it came from for follow-up analysis.
Not all small molecules in the hit structures can be docked to the query. The alignment is required to have a minimum RMSD of 3A. Also at least half of the nearby residues need to be paired with the query structure by Foldseek. These parameters can be adjusted using optional parameters of the similarstructures ligands command.
      > usage foldseek ligands
      similarstructures ligands [rmsdCutoff 3.0] [alignmentRange 5.0] [minimumPaired 0.5] [combine true]
         — Find ligands in Foldseek hits and align to query.