
|
Last updated November 2021 using Modeller v10.1; a different Modeller version or changes in the AlphaFold database may give different results, but the steps in the tutorial can still be followed.
The Model Loops tool in ChimeraX uses the program Modeller to fill in missing segments or to generate additional conformations for an already existing part of a protein structure. A missing segment is a gap in the atomic structure of a chain where the density was not clear enough to determine coordinates. Missing segments are usually at termini or in loops, and internal missing segments (those not at termini) are shown with dashed lines in ChimeraX.
Although no software installation except ChimeraX is needed to follow this tutorial, a license key is required to run Modeller. Academic users can obtain a license key free of charge by registering at the Modeller website. We will model a missing segment with Modeller and compare the results to other structures.
Start ChimeraX. If you want to use the click-to-execute links, view this page in the ChimeraX Browser, e.g. by entering the ChimeraX command:
Command: open https://www.rbvi.ucsf.edu/chimerax/data/loop-modeling/loop-modeling.html
Fetch 1t2p, a structure of the enzyme sortase A from Staphylococcus aureus:
Command: open 1t2p
If you wish, review how to move structures (part of the Binding Sites tutorial). Feel free to rotate, translate, and zoom as you like throughout.
This enzyme recognizes proteins that contain a sorting signal LPXTG. It cleaves the signal between the T (threonine) and the G (glycine), then attaches the protein via the threonine to the bacterial cell wall. The structure 1t2p contains three copies of the enzyme, chains A-C, where only chain B has an internal missing segment. One way to see which ID goes with which chain is by using the Chain information table in the Log: clicking a chain ID in the left side of the table selects the chain. Selection is shown with a bright green outline. Clear the selection by Ctrl-clicking in “empty space” or by using the menu: Select... Clear.
If you just want to try Blast without running Modeller, skip from here to the Blast section.

|
We will model the missing segment of chain B. Model Loops requires an atomic structure and an associated sequence containing the segment to be modeled. We have the structure already open, so need only to show the associated sequence:
Command: seq chain /B
The sequence of chain B is automatically associated with its structure. When mouse focus is in the ChimeraX window, pausing the cursor over the sequence name (chain B) in the Sequence Viewer reports the association in a pop-up balloon. In the sequence, light blue boxes indicate β-strands, yellow boxes indicate α-helices, and the missing segment is outlined in black. Even though the segment is missing from the atomic coordinates, the entire sequence of the protein used in the experiment (as given in the metadata of the structure file) is shown in the sequence window.

|
Start Model Loops from the menu: Tools... Sequence... Model Loops. Enter the Modeller license key; this will be remembered in your preferences for later uses of the tool. Use the following settings:
Click OK to start the calculation, which will take a minute or two to run.
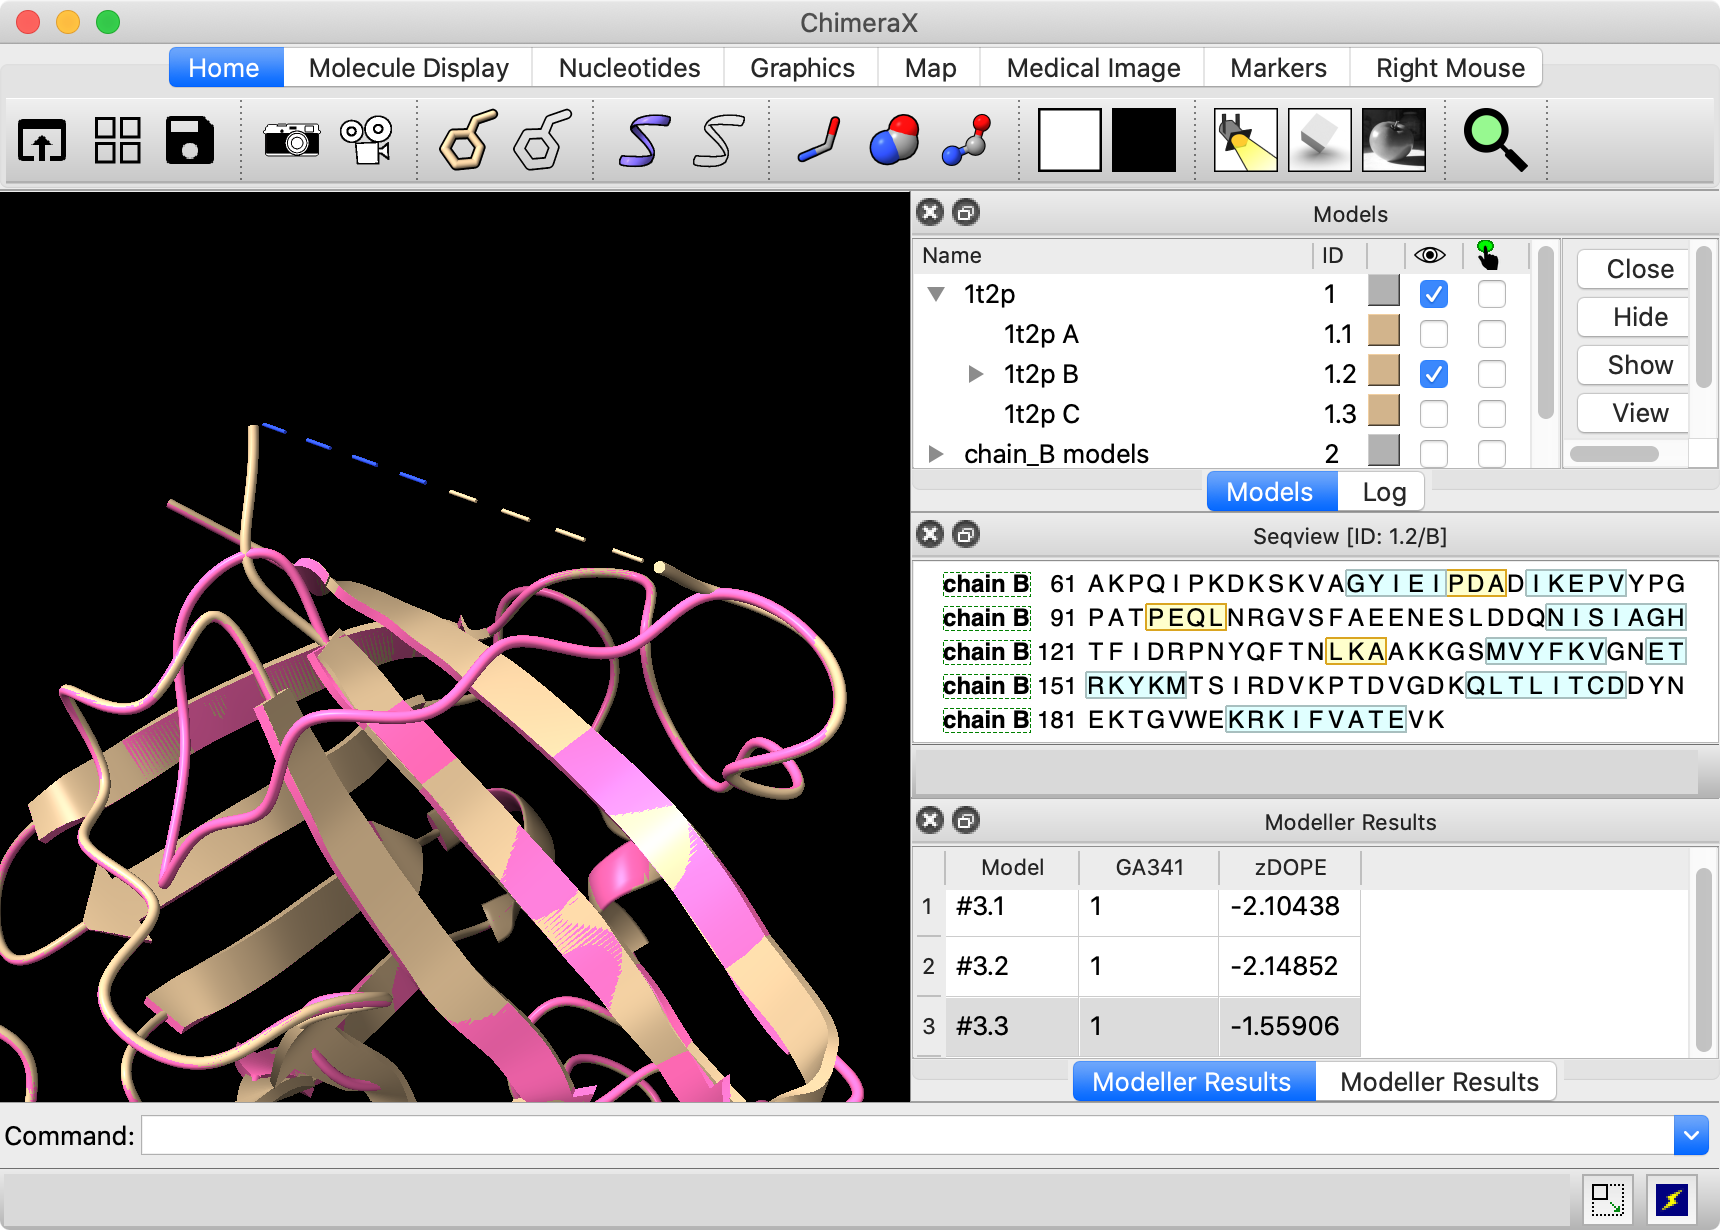
The resulting models are opened as #2.1, 2.2, and 2.3, and their scores are shown in a Modeller Results dialog. All three score reasonably well, with slight differences; the best zDOPE score is the most negative. Choosing rows in the dialog shows the corresponding results and hides the others.
Note: Only 3 models are calculated here for expediency, but for most research purposes, a higher number is recommended to give a larger set of conformations from which to choose.
In the figure, the Model Panel and Log have been tabbed together to make the window more compact (see panel and window controls).
To make it easier to compare the different chains of the original structure, split it into a separate model for each chain:
Command: split #1

|
|
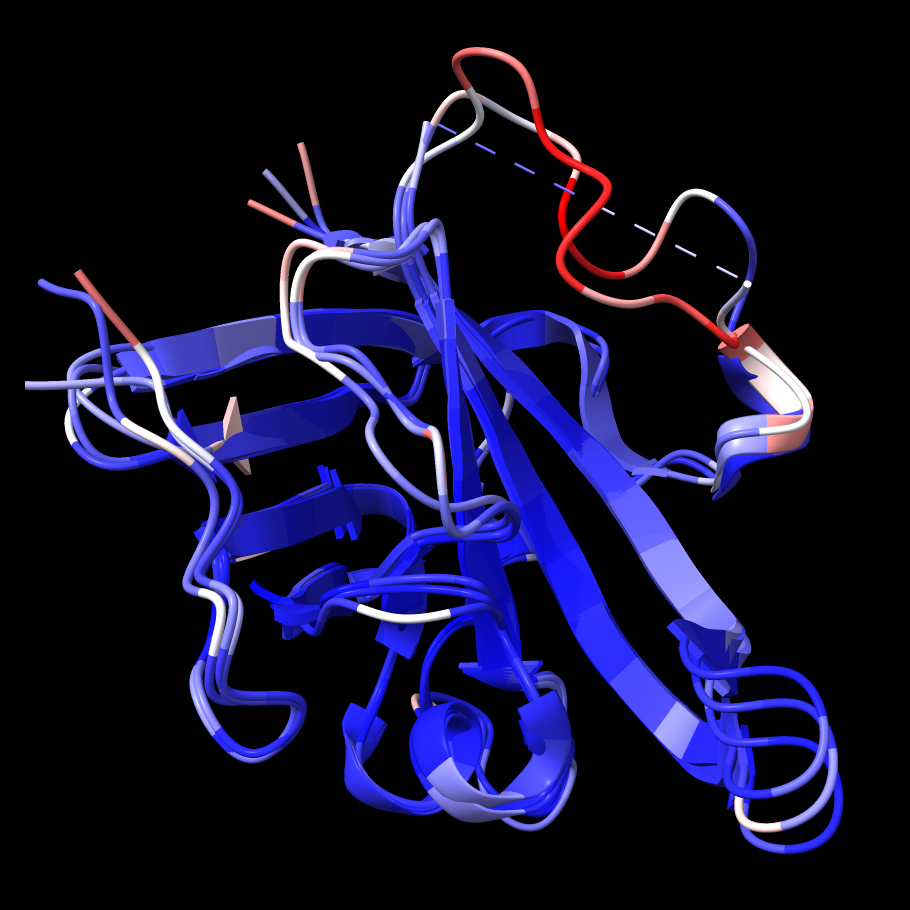
The segment missing from 1t2p chain B has the
highest B-factors in chains A and C. |
The Model Panel shows that model #1 has been split into #1.1 (chain A), #1.2 (chain B), and #1.3 (chain C). Temporarily hide the loop models (#2) and superimpose chains A and C of the original structure on chain B with mmaker (same as matchmaker):
Command: hide #2 models
Command: mm #1.1 to #1.2
Command: mm #1.3 to #1.2
Command: view
Alternatively, #2 could have been hidden by unchecking its show/hide
(![]() ) box in the
Model Panel.
) box in the
Model Panel.
Color the original structure by B-factor from blue (lowest) to white to red (highest):
Command: color bfactor #1
This shows that the most flexible parts of chains A and C correspond to the missing part of chain B, which makes sense. Undo the B-factor coloring and re-show the loop models:
Command: undo
Command: show #2 models
The loop models are not that similar to those in the original structure. This is not too concerning since we know that they are flexible, but a contributing factor is that the modeling only allowed one residue on either side of the missing segment to move. You can see that the path of this loop in chains A and C diverges from chain B by more than one residue on the N-terminal side of the missing segment (you can see residue numbers by pausing the cursor over a structure). We will repeat the loop modeling, allowing more residues to be flexible.
Note: The longer the segment being modeled, the more likely it is for some of the results to be poor (>50% poor predictions for segments with 10+ residues including the flexible positions, see Table 1 in Fiser et al., Protein Sci. 9(9):1753 (2000)).
Before running the calculation again, it is necessary to dissociate the new models from the chain B sequence (since we don't want to model additional copies of those) and reassociate the original chain B structure, since it got dissociated when the model was split.
Command: seq dissoc #2
Command: seq assoc #1.2
Associations can also be controlled in a graphical interface, shown by right-clicking (Ctrl-clicking if using a Mac single-button mouse or trackpad) in the Sequence Viewer and choosing Structure... Associations from the resulting context menu.

|
|
Especially when longer segments are modeled, some of the results may clash
with the rest of the protein and score relatively poorly. |
In the
Model Panel,
click the disclosure triangles ▼
on the left to collapse #1 and #2 into a single row each,
and uncheck the show/hide
(![]() )
box for #2 to hide the first set of loop-modeling results.
)
box for #2 to hide the first set of loop-modeling results.
Start Model Loops again from the menu: Tools... Sequence... Model Loops, and repeat the modeling as above, except with 2 adjacent flexible residues. Click OK to start the calculation, which will take a minute or two to run.
When the results appear (#3.1, 3.2, 3.3), change the color to make them stand out more:
Command: color #3 hot pink
Remember that clicking a row in the corresponding Modeller Results dialog (there will be two of these dialogs now, one for each loop-modeling run) shows just that submodel (e.g., #3.3) if its parent model is shown (e.g., #3 show/hide box checked in the Model Panel). The Model Panel show/hide checkboxes for the individual submodels can also be used.
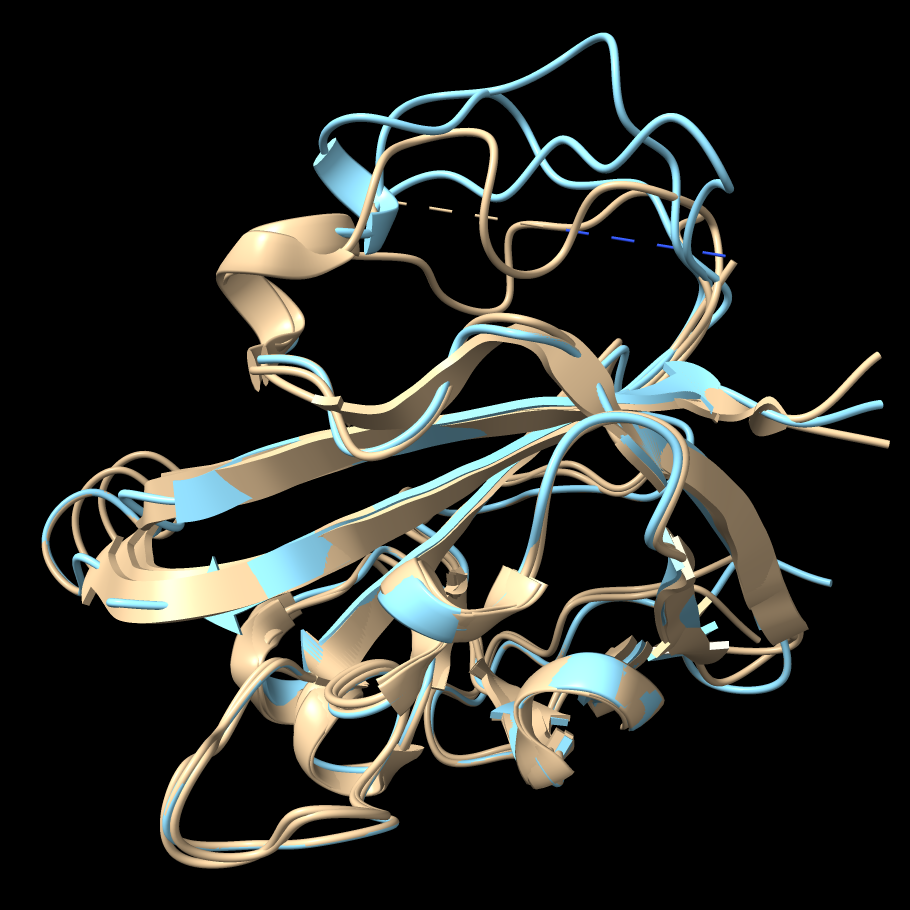
Two of the resulting loop models occupy roughly similar space to chains A and C in the original structure. However, the third, with the worst (least negative) zDOPE score, dives down into the rest of the protein and passes through another loop, as shown in the figure.
Find out how many self-clashes occur in each of these models:
Command: clashes #3.1 restrict #3.1 make f
Command: clashes #3.2 restrict #3.2 make f
Command: clashes #3.3 restrict #3.3 make f
The number of clashes is reported in the status line (transiently) and Log. The worst-scoring model #3.3 has a high number of self-clashes.
Continue to show and hide models as needed to compare any subset of the structures, since viewing them all at the same time is too complicated.

|
|
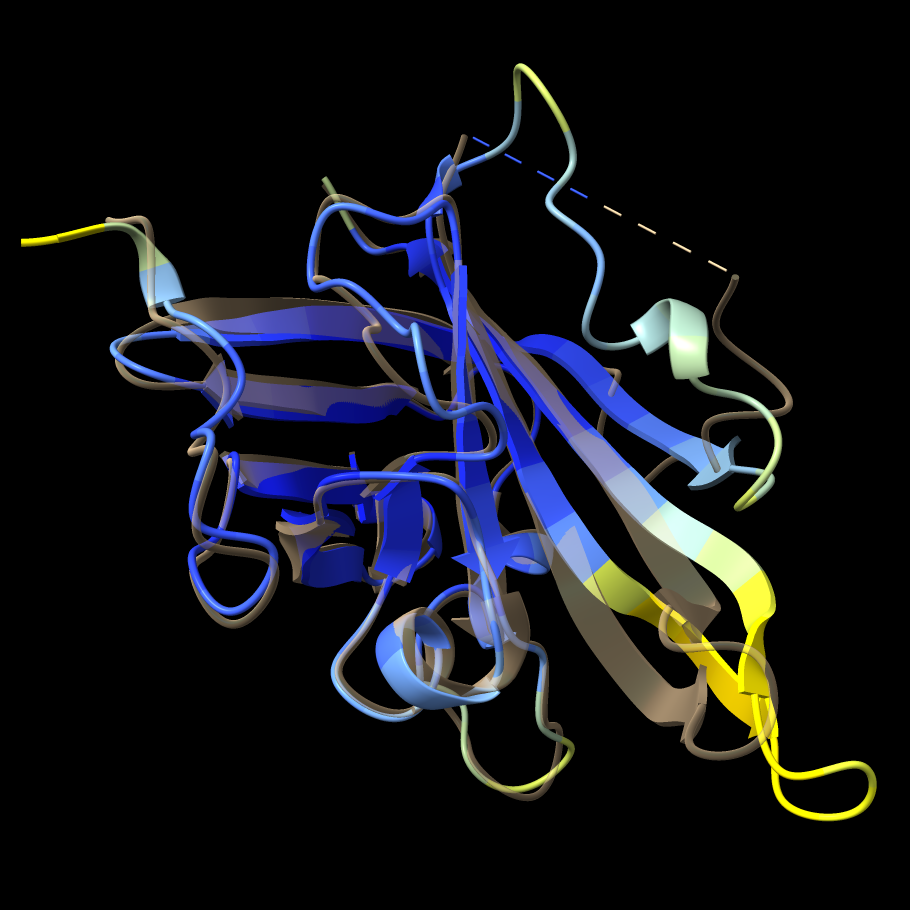
1t2p chain B (transparent) and AlphaFold prediction.
Command: transparency #1/B 65 target r ...and to return to opaque: Command: transparency #1/B 0 target r |
AlphaFold is a highly promising method that uses artificial intelligence to predict protein structures. The AlphaFold Database contains freely available predictions for several prominent model organisms and humans. However, it does not cover all of UniProt, nor does it include multimeric protein structures. The alphafold match command searches the database for the closest sequence match to a query chain. Search with chain B of the original structure:
Command: alphafold match #1/B
In this case, as reported in the in the Log, a prediction for UniProt ID Q2FV99 with 100% sequence identity to the query is found. The predicted structure is colored by confidence:
The AlphaFold model is mostly high-confidence, in part because there are many solved structures of this enzyme, as shown in the following section. When solved structures exist, AlphaFold can use them as templates.
As shown in the figure, the AlphaFold model backbone conformation differs from 1t2p chain B starting about a dozen residues from the N-terminal end of the missing segment. The loop-modeling runs above could not reproduce this conformation, since we only allowed 1-2 residues on either end of missing segment to be flexible. However, these differences don't necessarily mean that the modeling results are incorrect. The flexibility of this loop inferred from B-factors and the variability amongst the known structures of sortase A (more on this below) suggest it has multiple reasonable conformations.
If you want to try Blast without running Modeller, first go through the background and setup, and then return here.
Note: In a real research situation, it would be a good idea to search for related structures before modeling a missing segment. A structure of the same or a highly similar protein that contains the segment may be available.

|
Command: blast #1/B
When the Blast Results panel appears, drag it by its top bar out into a separate window. Make sure that Dockable Tool is unchecked in its context menu (shown with right-click, or Ctrl-click if using a Mac single-button mouse or trackpad) to prevent it from trying to insert back into the main window.
Each row is a “hit” (sequence similarity match to the query) chain in a PDB entry. The initial sort order is by match significance. The columns show information about the hit chains and the PDB structures in which they occur. You can:
For example, drag the divider to the right of the Title header to make that column wider.
Double-clicking any row automatically opens the hit and matches it onto the query chain. The whole PDB entry is opened, potentially including chains other than the hit; you may wish to hide or delete any extra chains. View any hits that you like, while continuing to show, hide, or close (careful: no undo except by reopening or recalculating) models using the Model Panel as needed to simplify the view.
NMR structures can be identified by the absence of a resolution value, and sometimes “solution structure” appears in their titles. NMR structures frequently contain an ensemble of multiple structures that satisfy the experimental constraints.
Structures of the same protein as the query, if any, should be in the top hits, and the query (if originally from the PDB) should “find itself.” The title, species, and UniProt ID columns help to indicate when a hit is the same protein as the query. Multiple UniProt IDs may share 100% sequence identity, however, so a different ID does not necessarily indicate a different protein sequence. For example, the self-hit row to 1T2P_B (see the figure) shows that the UniProt ID of the query is Q9S446, but we found above that UniProt Q2FV99 has the same sequence (100% ID). All of the hit rows visible in the figure (with list scrolled to the top) are for the same protein except for the bottom one, which according to the title, represents the sortase A from Bacillus anthracis. Many more hits with lower scores are not visible in the figure.
A few observations to explore if you wish: