
Tom Goddard
October 16, 2024, updated November 15, 2024
ChimeraX can plot protein mutation scores and visualize them on structures available using the mutationscores command. The purpose is to visualize scores from deep mutational scans where every residue of a protein is mutated to all 20 standard amino acids and multiple assays (often growing cells with different drugs and measuring cell viability or fluorescence) produces scores for all the resulting mutations. For a protein of 500 amino acids this produces 10000 mutations and with typically 5 assays generating 50000 scores. Scatter plots can show pairs of scores for all 10000 mutations, and scores can be used to color residues on a structure.
The described capabilties are in ChimeraX daily builds from November 16, 2024 or newer (in ChimeraX 1.9 but not in ChimeraX 1.8). An older version of these capabilities was in ChimeraX daily builds from June 11, 2024 until October 15, 2024. These capabilities were developed in collaboration with Willow Coyote-Maestas, Matt Howard and Ever O'Donnell at UC San Francisco.
Scores can be read from a comma-separated value file (.csv suffix). The first line must be a comma-separated list of the column names. The first column should be the mutation name in the format recommended for amino acid substitutions by the Human Genome Variation Society (HGVS) except with 1-letter amino acid codes used instead of the recommended 3-letter codes. For example mutating residue tyrosine 392 to alanine would be noted
p.(Y392A)
Example lines in the .csv file look like
variants,wildtype,position,mutation,type,surface,surface_se,abundance,abundance_se,dox,dox_se,mtx,mtx_se,sn38,sn38_se
p.(V6A),V,6,A,missense,0.052806582,0.311071605,0.095010571,0.391069124,-0.549746993,0.43742939,0.253708238,0.317841138,-0.373043663,0.444088911
p.(V6C),V,6,C,missense,0.132574054,0.300261964,0.129538083,0.371928707,-0.012776432,0.376829305,-0.005007274,0.220479589,0.447843883,0.270068523
...
Deep mutational scans often include amino acid deletions which can be noted like "p.(V6del)" for deletion of valine residue 6. ChimeraX currently does not show the deletions so will ignore those lines.
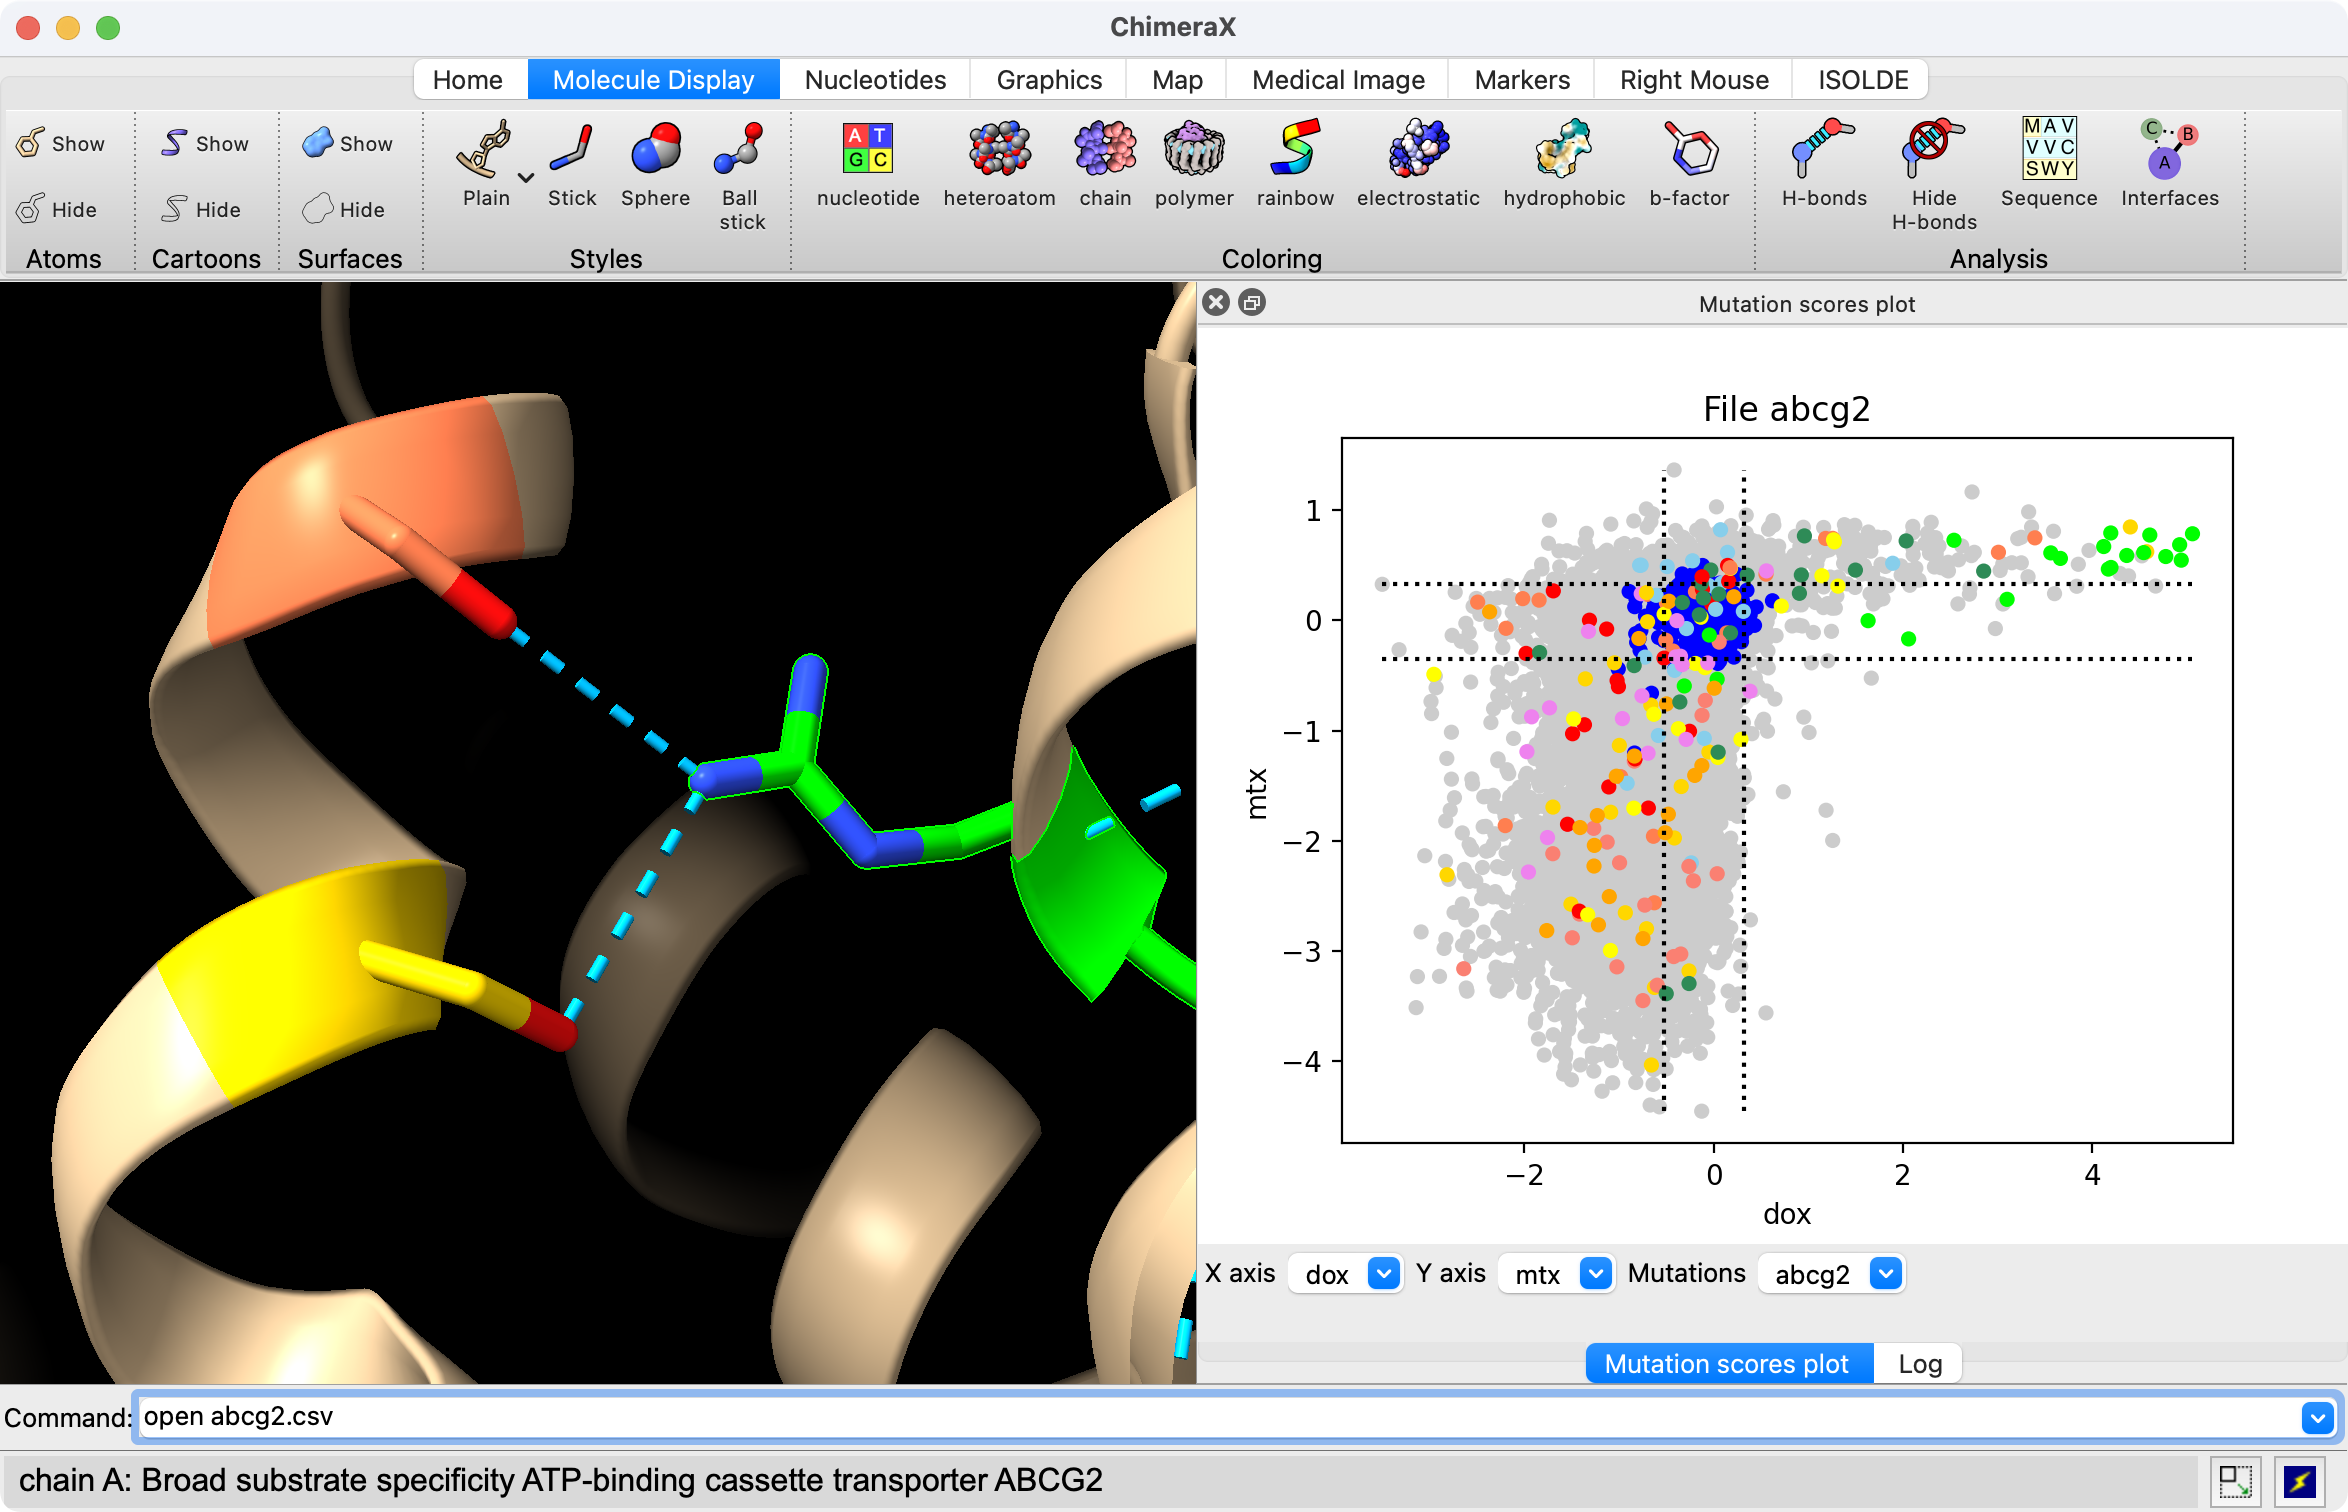
The open command or menu entry File / Open... can be used to open the .csv score files.
open abcg2.csv
Opening an atomic structure with the same sequence as the mutation data allows coloring and showing where the mutations are in the structure.
open 6vxf
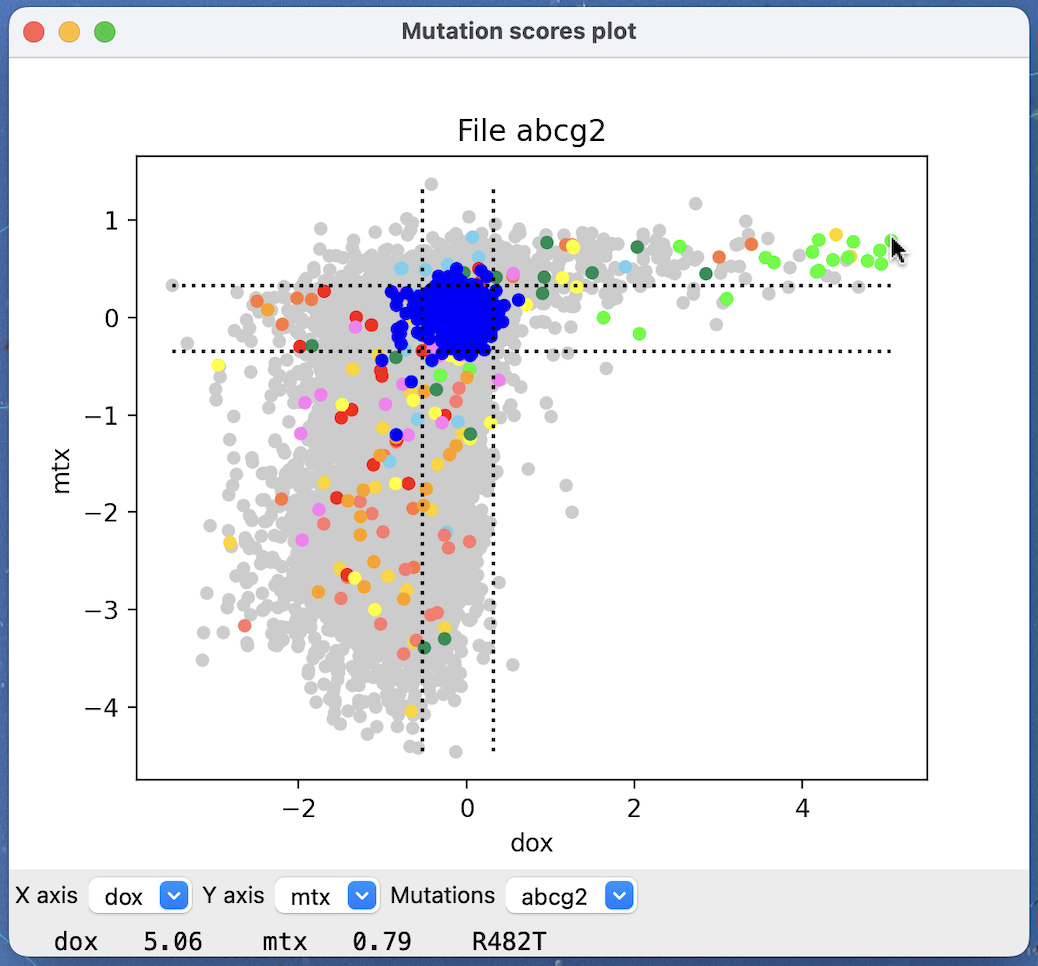
Opening mutation data will display a scatter plot where a small gray circle is plotted for each mutation with x and y coordinates given by two of the scores in the mutation data. Synonymous mutations (change in DNA sequence that does not change the amino acid) will be shown as blue circles, and vertical and horizontal lines show the mean plus or minus two standard deviations of the synonymous mutation scores.
Menus for the x-axis and y-axis scores to use are at the bottom of the plot, and a menu for choosing which set of mutations if multiple mutation files have been opened.
The scores and mutation at the mouse position are displayed at the bottom of the plot.
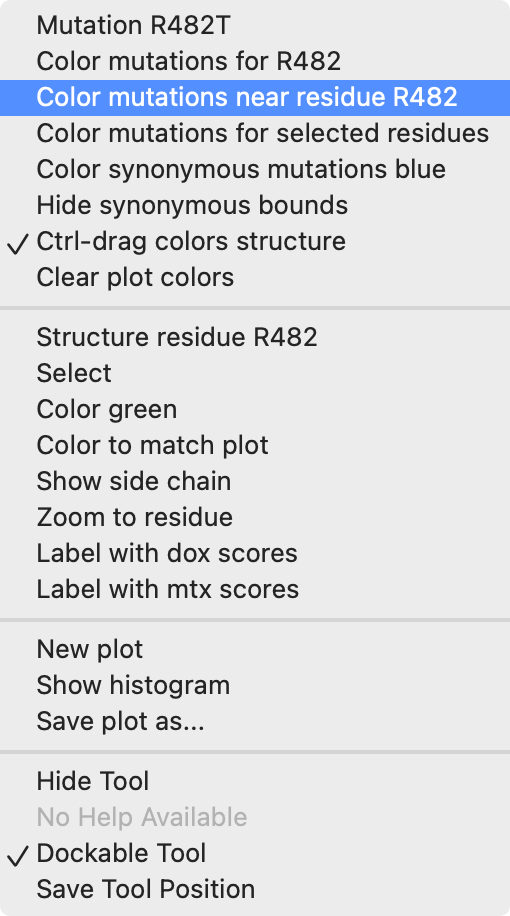
Clicking on a gray circle in a mutation scatter plot shows a menu that colors mutations and can color or select or show residues on associated atomic structures.
Dragging a box in the scatter plot with the mouse while holding the control key down colors the mutation circles green and selects the residues for the mutations in the box on associated atomic structures. If the context menu option Ctrl-drag colors structures is enabled then the residues are also colored green and all other residues of the chain are colored lightgray to show where the mutations are in the structure.

|

|
A histogram of the values for a given score for all mutations can be displayed with scatter plot context menu entry Show histogram or with the mutationscores histogram command
mut histogram sn38
The orange curve shows a smoothed version of the binned values in gray. The blue bars show a histogram of just the synonymous mutations, and vertical dotted lines show the mean plus or minus two standard deviations of the synonymous scores. Menus at the bottom of the histogram allow choosing which score to show and from which mutations file.
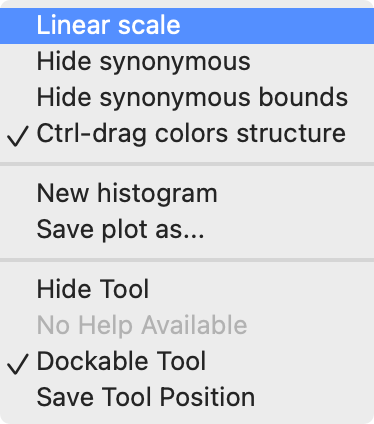
Clicking on the histogram shows a popup menu.
The scatter plot context menu entries the color or show atomic structure residues use structure chains that have matching sequence and residue numbering as the mutation data. Chains are automatically chosen and associated with the mutation data. To control which chains are associated you can specify them when you open the mutation .csv file
      open 6vxf
      open abcg2.csv chain /A
or afterwards using the mutationscores structure command
      open abcg2.csv
      open 6vxf
      mutationsscores structure /A
If the atomic structure does not have an identical sequence but uses the same residue numbering you can allow the association by adding the "allowMismatches true" option.
mutationsscores structure /A allowMismatches true
If the atomic structure is a homolog with different residue numbering you can have ChimeraX compute a sequence alignment using Clustal Omega to pair the mutation score sequence with the atomic structure by giving the "alignSequences ABCG2_HUMAN" option. The value specified is the Uniprot name for the mutation scores sequence which will be aligned with the atomic structure sequence. The computed sequence alignment will be shown and is done automatically using the sequence align command.
mutationsscores structure /A alignSequences ABCG2_HUMAN
You can also specify your own alignment using the alignSequences option. See the mutationscores command documentation for detais. The alignSequences option was added in Chimera daily builds from February 21, 2025 and newer and is not available in the older ChimeraX 1.9 release.
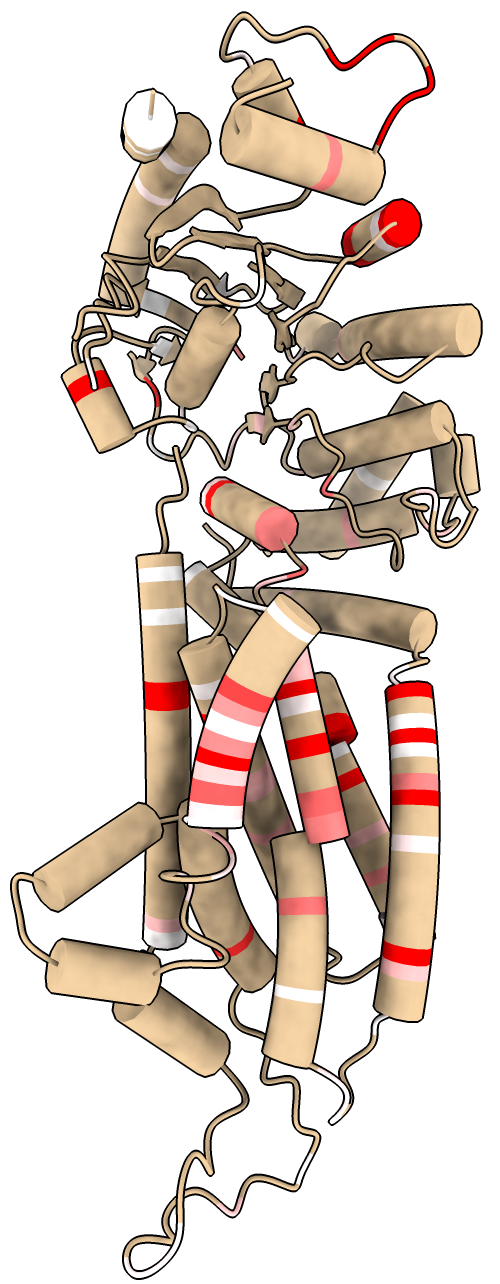
The mutationscores define command can compute new per-residue scores based on the individual mutations scores by summing, averaging, counting mutations above a threshold, ..., and assign these scores a name. Per-residue scores can be used to color an atomic structure and in residue scatter plots. For example, to define a gain of function score based on existing drug score dox and then to color the associated atomic structures using this new residue score:
      mut define dox_gain from dox above 0.5 combine sum
      > Defined score dox_gain for 119 residues using 300 mutations
      > Set attribute dox_gain for 110 residues of chain /A
      color byattribute r:dox_gain /A palette 0.5,white:5,red
The coloring can also be done using the Render by Attribute graphical user interface in menu Tools / Depiction. The output of this mutation define command indicates that only 119 of the residues have a mutation with dox score above 0.5 and that the atomic structure only contains coordinates for 110 of those residues.
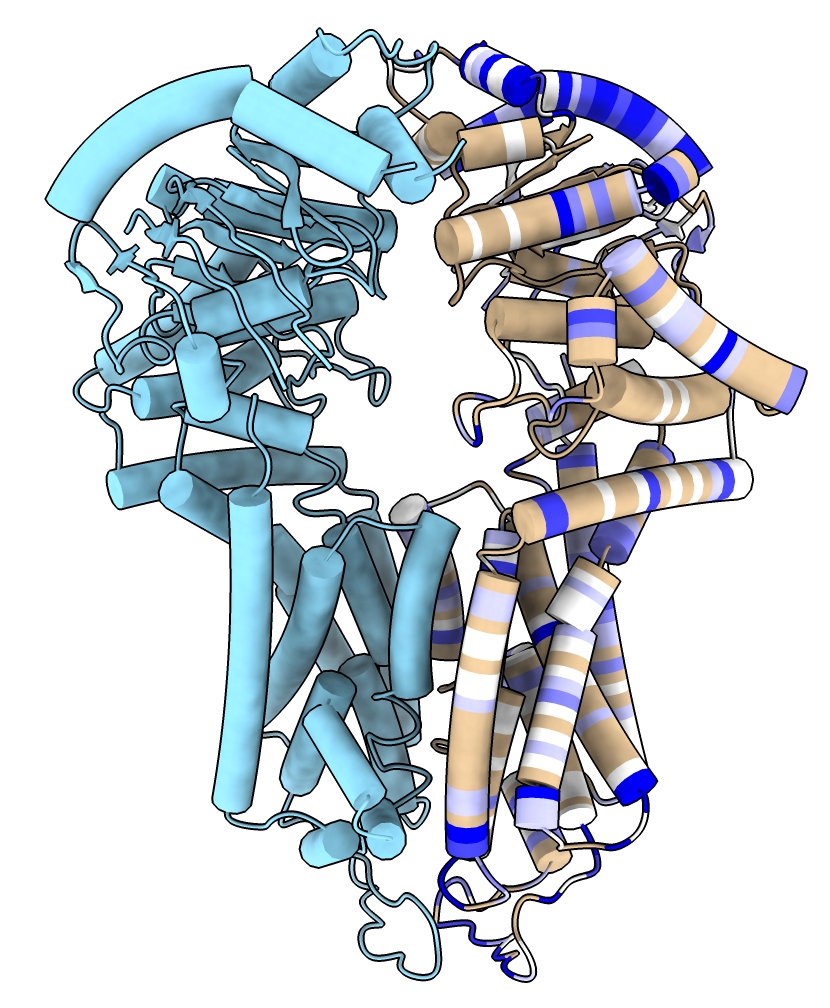
The mutationscores define command can also be used to name an interesting subset of the mutations. For example to define the set of mutations where the dox drug score is unusually low or high but the mtx and sn38 drug scores are in the wild-type (synonymous mutation) range to look for residues involved in dox specificity
      mut def dox_only from dox ranges "(dox >= 0.4 or dox <= -0.5) and -0.3 <= mtx <= 0.3 and -0.8 <= sn38 <= 0.8"
      > Defined score dox_only for 1149 mutations
Then to color the structure to show these, with darker colors where more mutations of a residue exhibit dox specificity
      mut def dox_res from dox_only combine count
      color byattribute r:dox_res /A palette 1,white:5,blue
Scatter plots and histograms can be created for computed residue scores created with the mutationscores define command. The computed score names are listed in the menus at the bottom of those plots. When displaying two computed residue scores in a scatter plot the circle markers each represent one residue and will have the residue name and number written in the circle.

Labels can be added to residues on an atomic structure using the mutationscores label command that show scores for all mutations to the 20 standard amino acids. Each label shows a 4 by 5 grid where each square has a one-letter-amino acid code and is colored to indicate the score mutating to that amino acid.
mut label /A:482,443,440 dox
Blue values indicate higher scores and red values lower scores. The colors and score values for each color can be set with the palette and range options.
Multiple sets of mutations can be opened, for instance, mutations that apply to different proteins that form a complex. Each set will be named according to theh .csv file name, and the mutationscores commands can be applied to a specified sets by adding the mutationSet option. For exampple, if abcg2.csv is one set of mutations
mut scatter mtx sn38 mutationSet abcg2
If only one set of mutations (one .csv file) is opened then the commands do not need to specify the set, as in the examples in previous sections.
The mutation scores tool can fetch predictions of pathogencity of every mutation of every human protein in UniProt from the AlphaMissense database.
open ABCG2_HUMAN from alpha_missense
The scores range from 0 (benign) to 1 (pathogenic) and read into a mutation set named the same as the UniProt name or accession code with a single mutation score name amiss. All of the mutation scores commands and user interfaces can be used with this data in the same way as for experimental mutation scores. Synonymous scores are not included. Fetched scores are saved in ~/Downloads/ChimeraX/AlphaMissense and are fetched from the AlphaFold database at EBI. Optionally the open command can specify structure chains to associate. If a chain does not have exactly the same sequence (same numbering and amino acid types) as the mutation data then the allowMismatches true option can be specified. The name to give the created mutation set can be specified with the identifier option. Specifying a name of an already opened mutation set will add the scores to that set. For example
open ABCG2_HUMAN from alpha_missense chain #1/B identifier ABCg2
I added the AlphaMissense scores in the hope that they would be interesting to compare to experimental scores. But about half of the mutations are scored as pathogenic while experimantal assays give a more nuanced view of specific gain and loss of function and I have not found the comparison to be useful so far.
The mutation scores tool can fetch PolyPhen-2 and SIFT predictions of pathogencity for clinically observed variants for human proteins found in UniProt found on the UniProt Variants web pages.
open ABCG2_HUMAN from uniprot_variants
PolyPhen-2 scores range from 0 (benign) to 1 (pathogenic) while SIFT scores range from 0 (pathogenic) to 1 (benign). Fetching scores creates a mutation set named the same as the UniProt name or accession code with _variants appended and score names are PolyPhen and SIFT (and possibly others if UniProt in the future includes other scores). All of the mutation scores commands and user interfaces can be used with this data in the same way as for experimental mutation scores. Only some mutations are reported, ones found in clincal gene sequencing. Fetched scores are saved in ~/Downloads/ChimeraX/UniProtVariants and are fetched from the UniProt database. Optionally the open command can specify structure chains to associate. If a chain does not have exactly the same sequence (same numbering and amino acid types) as the mutation set then the allowMismatches true option must be specified. The name to give the created mutation set can be specified with the identifier option. Specifying a name of an already opened mutation set will add the scores to that set. For example
open ABCG2_HUMAN from uniprot_variants chain #1/B identifier ABCg2
I added the UniProt scores in the hope that they would be interesting to compare to experimental scores but like the AlphaMissense scores I have not found the comparison useful.
Open mutation scores, new score definitions, scatter plots, histograms, residue labels and umap plots are saved in ChimeraX session files (suffix .cxs).
mutationscores scatterplot x-score y-score [colorSynonymous true | false] [bounds true | false] [correlation true | false] [replace true | false] [mutationSet name]
Show scatter plot of residues using two mutation scores x-score and y-score. If a mutation only has one of the two scores then it does not appear on the plot. If colorSynonymous is true then any synonymous mutations will be colored blue in the plot, non-synonymous are colored lightgray. If bounds is true then vertical and horizontal dotted lines are shown on the plot and positions mean plus or minus two standard deviations of synonymous mutation scores. This is intended to give approximate wild-type score ranges for the x-axis and y-axis scores. A line showing a least squares fit can be shown on the plot using the correlation true option. By default the scatter plot replaces any previous scatter plot for the same score set unless the replace false options is given. Mutations shown on the scatter plot can be colored using menu entries shown by clicking on the plot, and coloring, selection and display of residues of associated atomic structures can also be controlled by these menu entries.
mutationscores histogram score [bins b] [scale linear | log] [curve true | false] [smoothWidth w] [smoothBins b] [synonymous true | false] [bounds true | false] [replace true | false] [mutationSet name]
Show histogram of mutation scores. The number of bins can be specified and defaults to 20. A smooth curve can be drawn approximating the histogram that uses a Gaussian convolution with the histogram bin height function. The width (standard deviation) of the Gaussian can be specified with the smoothWidth option and defaults to 0.1 times the standard deviation of all the score values. The smooth curve is computed with a finer spaced set of bins given by smoothBins (default 200). The bar heights for the histogram can be shown on a log or linear scale using the scale option (default log). Synonymous mutations can be shown in an overlaid set of histogram bars shown in blue if synonymous is true, and vertical dotted lines indicating the mean plus or minus two standard deviations of synonymous values can be shown with option bounds true. By default the new histogram plot replaces any previous histogram for the same set of scores unless the replace false option is used.
mutationscores define [new-score] [fromScoreName from-score] [subtractFit sub-score] [aa one-letter-codes] [toAa one-letter-codes] [synonymous true | false] [above value] [below value] [ranges comparison-expression] [combine count | mean | stddev | sum | sum_absolute] [setAttribute true | false] [mutationSet name]
mutationscores undefine score [mutationSet name]
Compute and name a new score from an existing mutation score. The new score name can be used in the other mutationscores commands just like an experimental score. If no options to the define command are given, the existing score names are listed.
The new score can also define an interesting subset of mutations. The aa and toAa options limit the new score mutations to specific before and after amino acid types. Specifying the synonymous option as true limits the new score mutations to those with the same before and after mutations (ie. scores which reflect wild-type, or no change at the residue position, but possibly a nucleic acid codon difference). The above and below options limit new score mutations to from score values above a given value and below an given value. This can also be achieve in a more flexible way with the ranges option which specifies a boolean expression involving any existing scores combined "and", "or", "not", ">", ">=", "<", "<=", "!=", "==" operators and parentheses, for example, "mtx <= -1.5 and sn38 >= 1.0".
Definitions can create a per-residue score if they produce only a single score per residue. Several options create per-residue attributes: synonymous true, or combine, or toAa with a single amino acid type specified. The combine option combines the scores for all mutations of a residue using the specified operation. If the setAttribute options is true (the default) then defining a per-residue scores sets a residue attribute with the same name as the newly defined score name on associated structure residues.
The subractFit option does a linear least squares fit of the from score to the score specified with the subtract fit option and subtracts the linear values from the from scores. The typical use of this would be to normalize a score. For instance if the from score is a cell growth measure in response to a drug and the subtract score is a surface expression score for the protein, then the subtraction attempts to normalize the drug response to account for different amount of the mutated protein reaching the membrane. The variation in response might not be a linear function of the quantity of surface expressed protein, which is a limitation of this simplistic normalization.
mutationscores label residues score [range min,max | full] [palette colormap] [noDataColor color] [height h] [offset x,y,z] [onTop true | false] [mutationSet name]
Show color-coded residue labels for mutation scores on an atomic structure. The label shows a 4 row by 5 column grid of colored colored squares for the 20 standard amino acids, each square colored by the mutation score value and containing the one-letter-code for the amino acid. The default color palette is redblue which contains equally space red white and blue colors and spans the full range of scores across all mutations (including for residues not being labeled). The color palette and range can be specified with the palette and range options. For mutations that don't have scores the noDataColor is shown defaulting to gray. Above the 4 by 5 grid is the wildtype amino acid code and residue number. The height of the entire label is given by the height option and defaults to 1.5 Angstroms. The offset parameter specifies how to displace the label from the C-alpha atom position in x,y,z and defaults to 0,0,3. To place labels on top of other parts of the structure that may occlude them use the onTop true option. Labels can be deleted with the label delete command.
mutationscores statistics score [type all | synonymous] [mutationSet name]
Compute mean and standard deviation of mutation scores. By default statistics are computed just for the synonymous mutations as that is most often of interest for gauging the wild-type score ranges, but statistics for all mutations can be reported using the type all option.
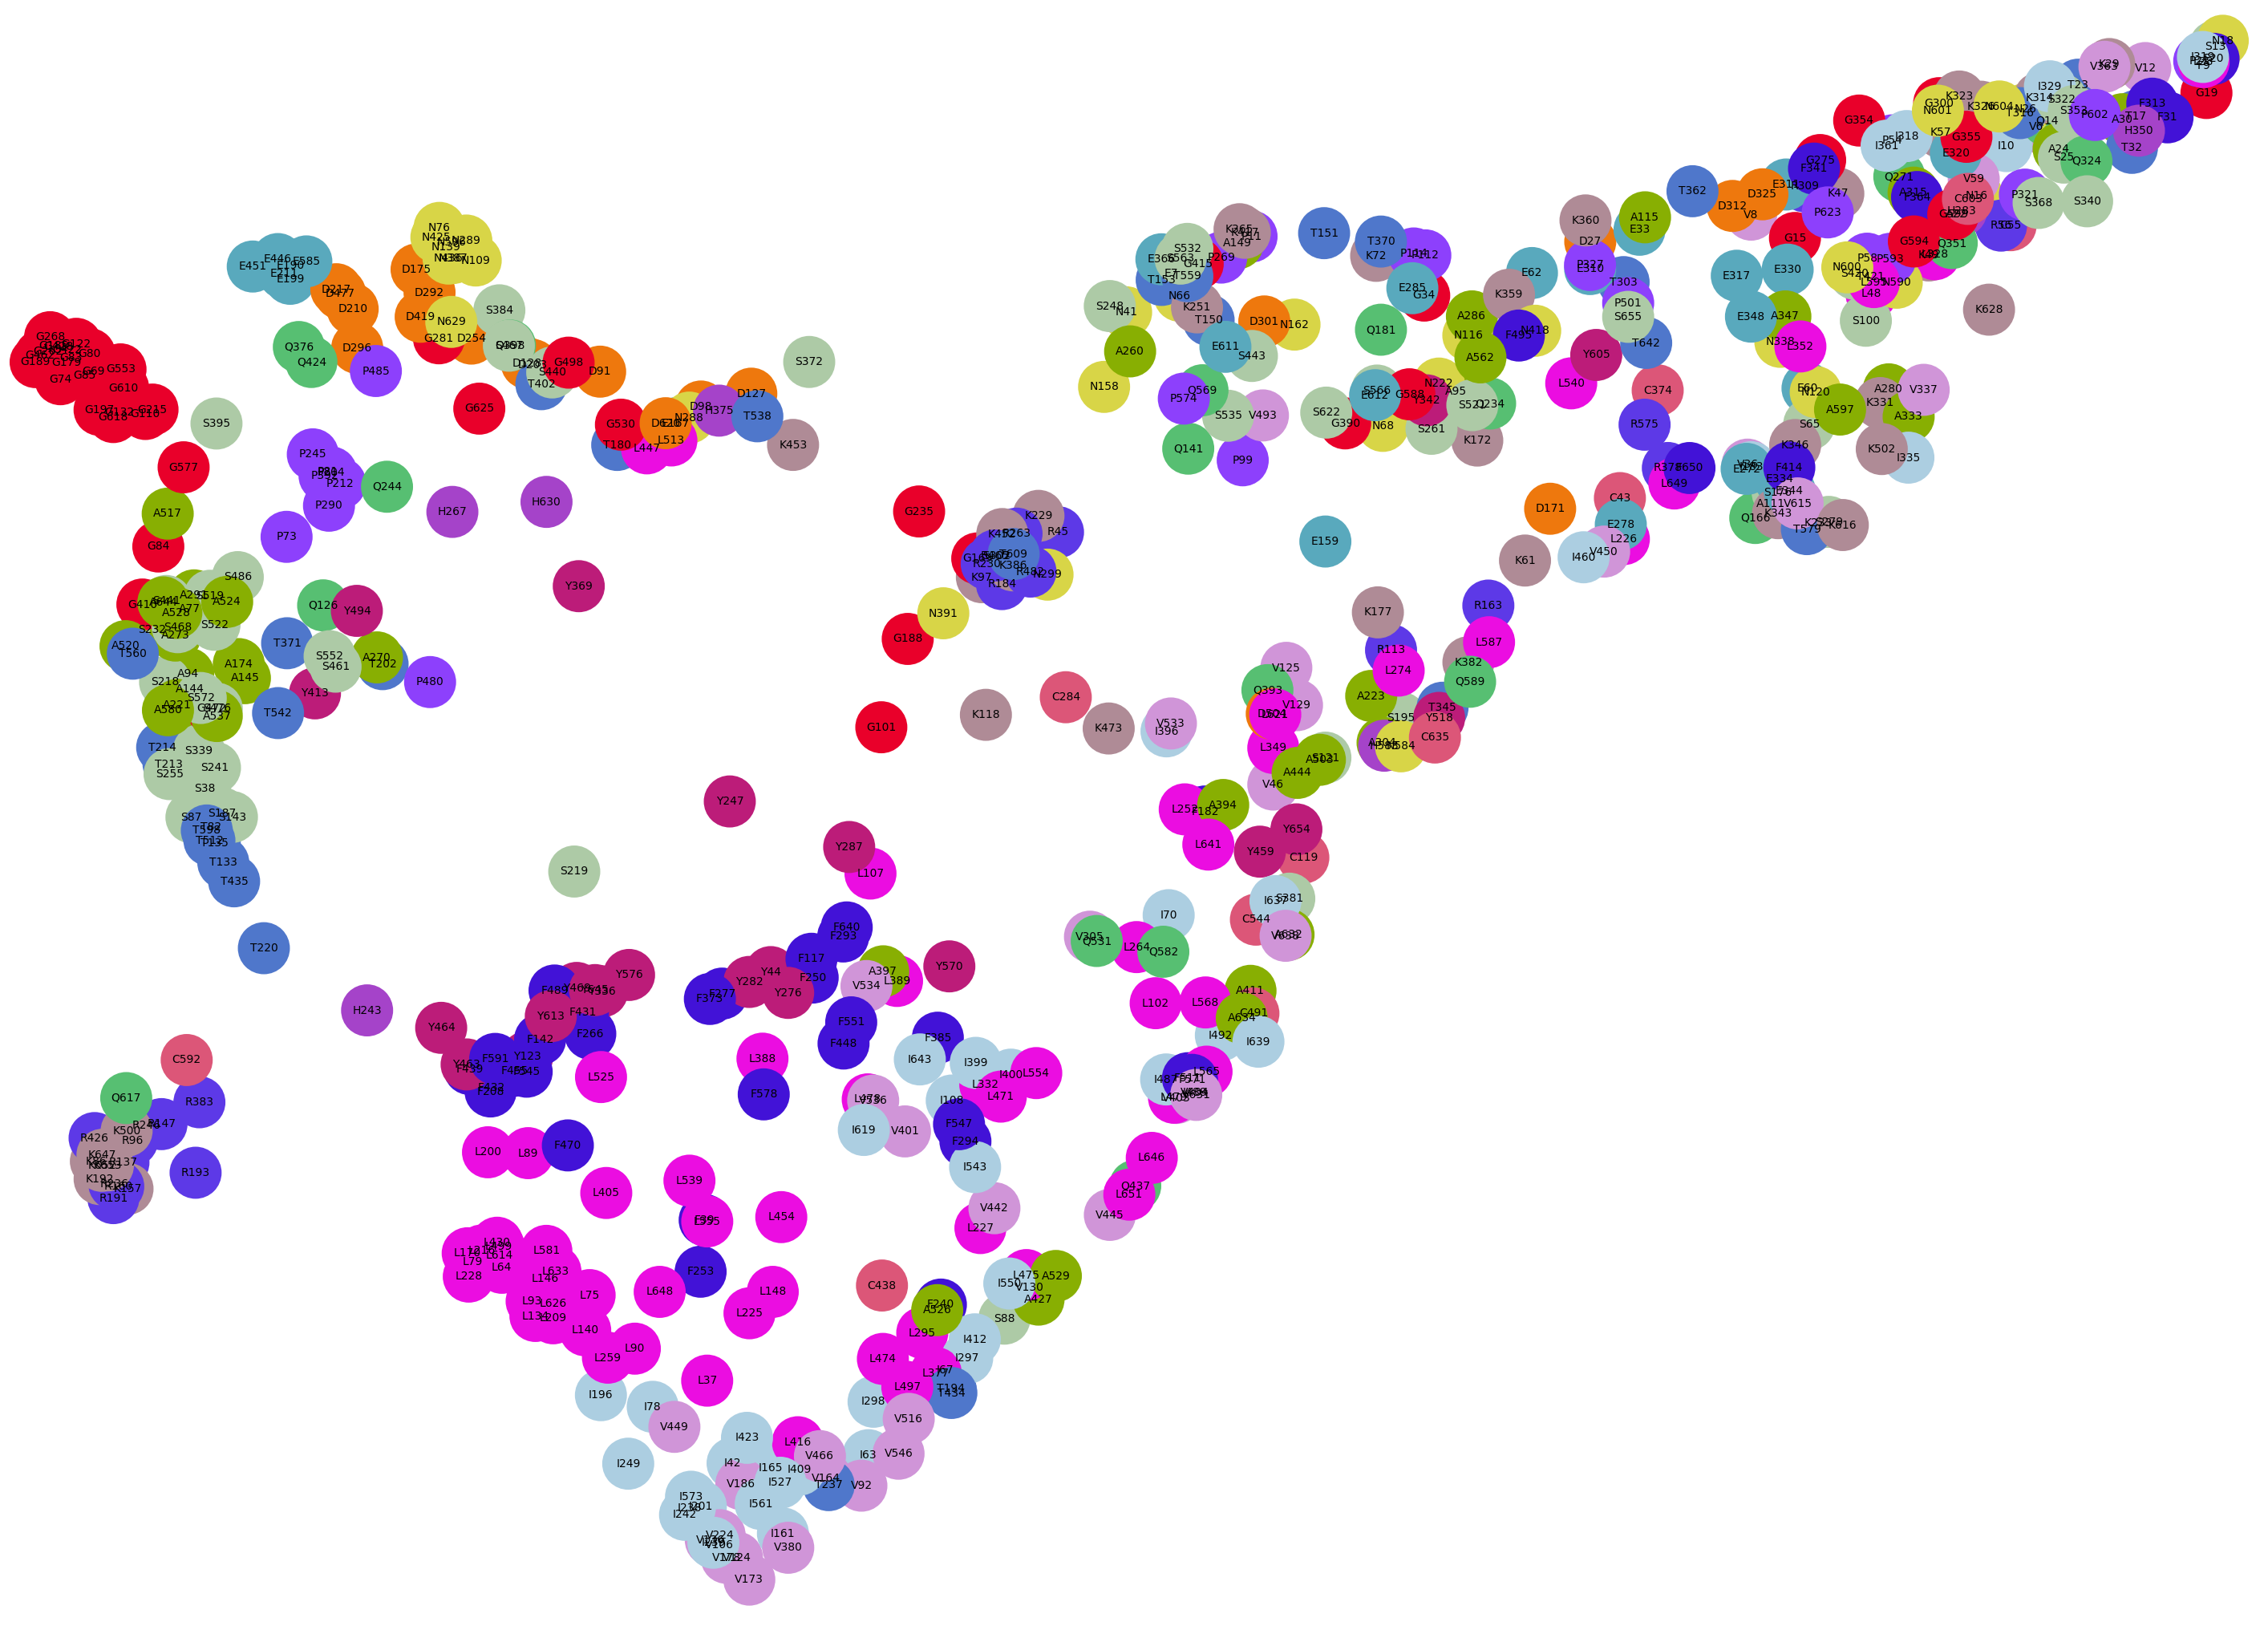
Command mut umap sn38 Some clustering of glycines (red), alanines (olive), lysines (pink) and valines (light blue) seen. |
mutationscores umap score [mutationSet name]
For each residue the mutation scores for the 20 possible mutations can be considered as a vector in a 20 dimensional space. This command projects this set of vectors to 2 dimensions using the Uniform Manifold Approximation and Projection (UMAP) algorithm and plots them. Each residue is plotted as a colored disk with distinct colors for the 20 amino acid types, and labeled with the residue number. Only residues for which all 20 possible mutations have scores are included. This command tries to see if there are patterns in the scores for mutations to specific residue types (e.g. mutating a hydrophobic residue to hydrophillic ones might be detrimental to protein function). This command was an experiment and it didn't show interesting patterns in my tests on a few proteins. In the future this command might be adapted to try projecting different vectors derived from the mutations scores to see patterns.
mutationscores structure chains-spec [allowMismatches true | false] [alignSequences mutations-sequence|alignment-id] [mutationSet name]
Associate one or more structures with a set of mutation scores. If no chains are associated then actions that try to use associated structure residues will attempt to automatically associate the mutations with open chains with matching sequence and numbering. The ChimeraX "open" command can also be used to specify associated chains using the chains option, for example, "open myscores.csv chains #2/B". The allowMismatches option can be set to true to permit associating chains whose sequence does not match exactly. The association will pair residues with the same numbers in the chain and the mutation data. To associate homologs chains that may have different residue numbering use the alignSequences option and specify the full sequence of the mutation data using a Uniprot id or explicit sequence string to have ChimeraX compute a sequence alignment between the mutation data sequence and specified chains using the Clustal Omega sequence alignment server. Alternatively you can open a multiple sequence alignment (e.g. FASTA file) and specify the alignment id given in the titlebar of the alignment panel with the alignSequences option to have the association use your custom alignment. The alignSequences option was added in Chimera daily builds from February 21, 2025 and newer and is not available in the older ChimeraX 1.9 release.
mutationscores list
List names of sets of mutation scores.
mutationscores close [mutation-set]
Close the specified set of mutation scores.