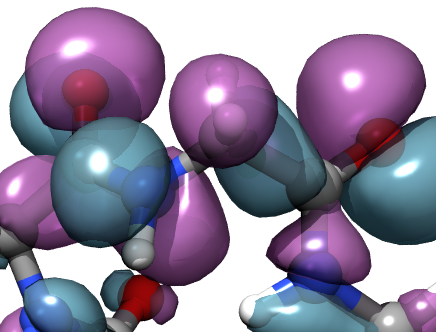
Molecular orbitals
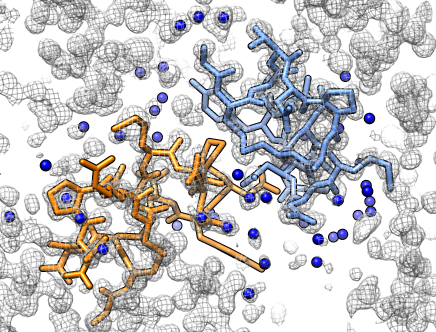
X-ray density map
Chimera tutorial
USCF Mission Bay Library
July 15, 9:00 - 11:00 AM
|
Molecular orbitals |
X-ray density map |
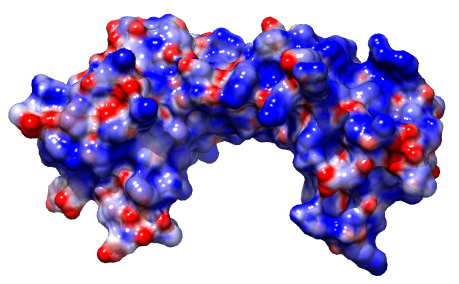
Electrostatic potential | 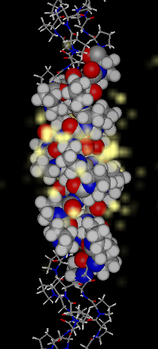
Water occupancy | 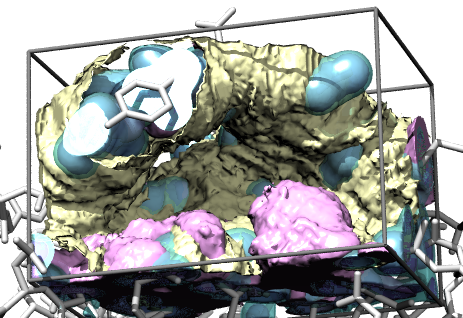
DOCK scoring grids |
Electron microscope single particle reconstructions | 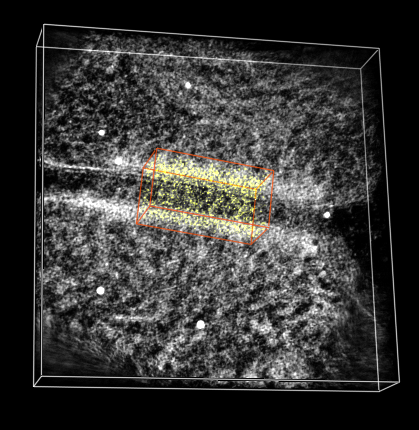
Electron microscope tomography | 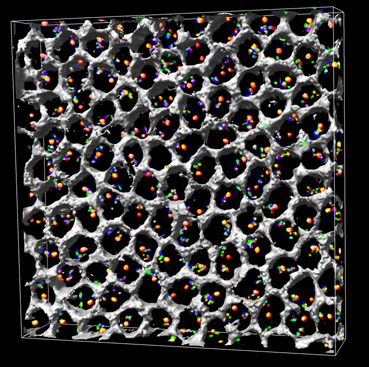
3-d light microscopy (wide-field, confocal, ...) |
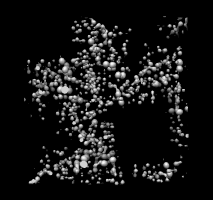
1a0m.omap | 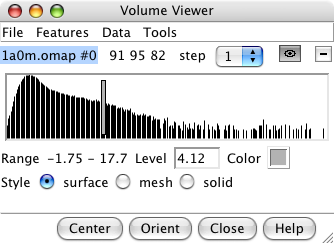
volume dialog | 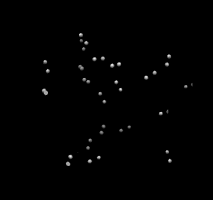
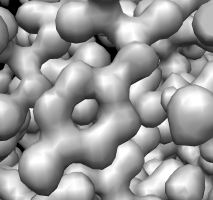
high contour level, disulfides | 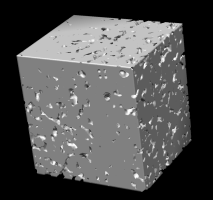
low contour level, data bounds |
Tyrosine residue in density. | 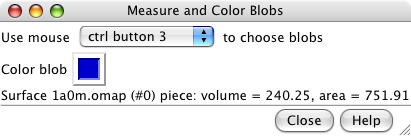
Measure and Color Blobs. | 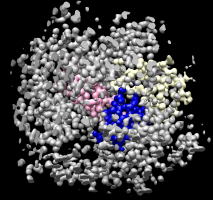
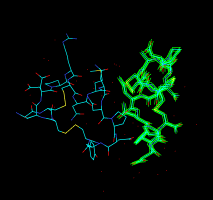
Colored protein copies. |
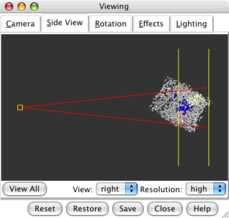
Side view dialog | 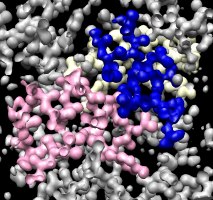
Clipping density in front. | 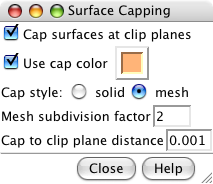
Surface capping dialog. | 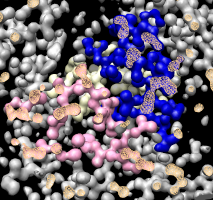
Covering holes in surface. |
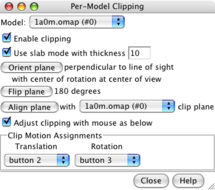
Per-model clipping dialog. | 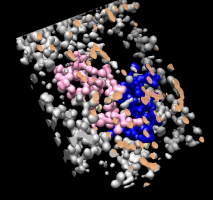
Slab clipping. |
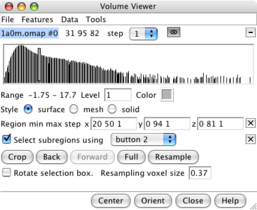
Subregion selection panel. | 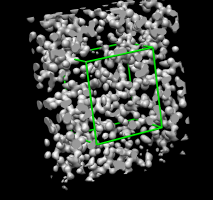
Green outline box. | 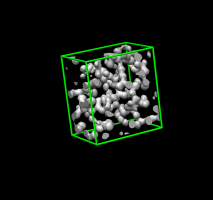
After pressing Crop. |
Atomic model (PDB file). | 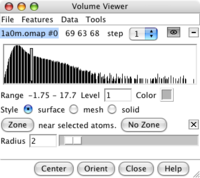
Zone panel. | 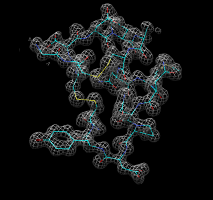
Zone around chain A. |
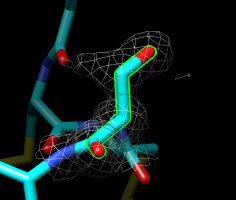
Serine 4, chain A. | 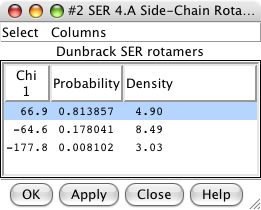
Rotamers dialog. | 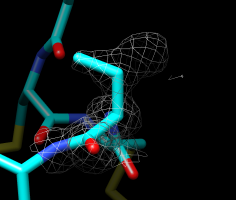
Second best orientation. |
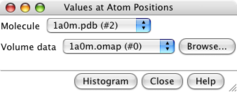
Values at atom positions. | 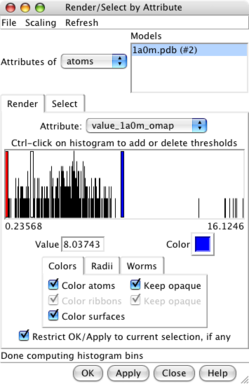
Render by attribute dialog. | 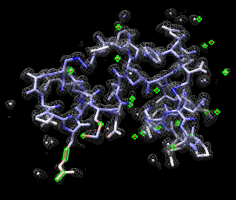
Atoms colored by density. | 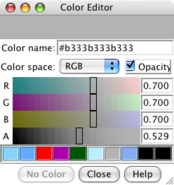
Color chooser. |
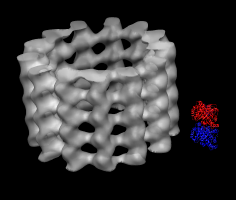
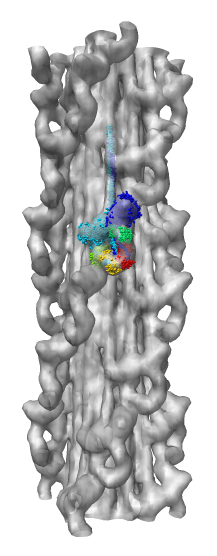
Microtubule map and tubulin dimer. | 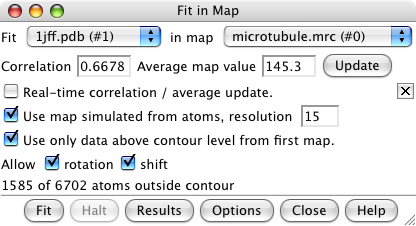
Fit in map dialog. | 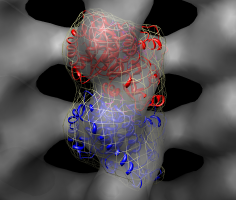
Fit tubulin including simulated map. |
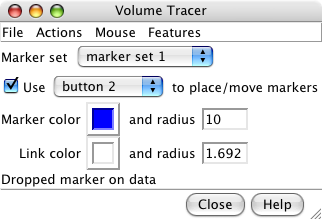
Volume tracer dialog. | 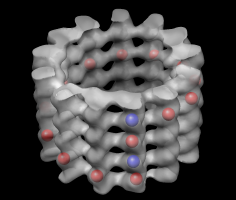
Markers for tubulin monomers. | 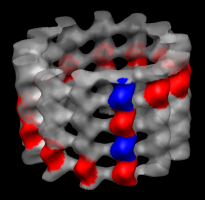
Colored map. | 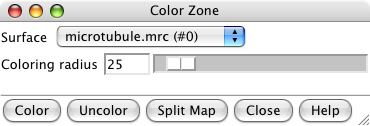
Color zone dialog. |
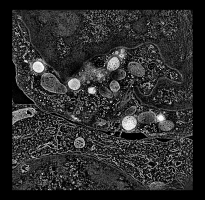
Human cytotoxic T-cell. | 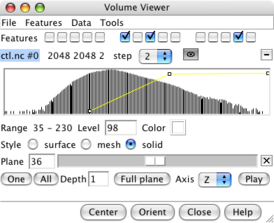
Volume planes panel. | 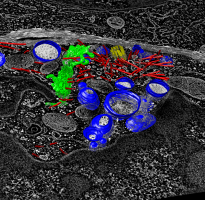
Traced objects from IMOD. | 
Masked vesicle. |