
Membrane mask with jagged surface.
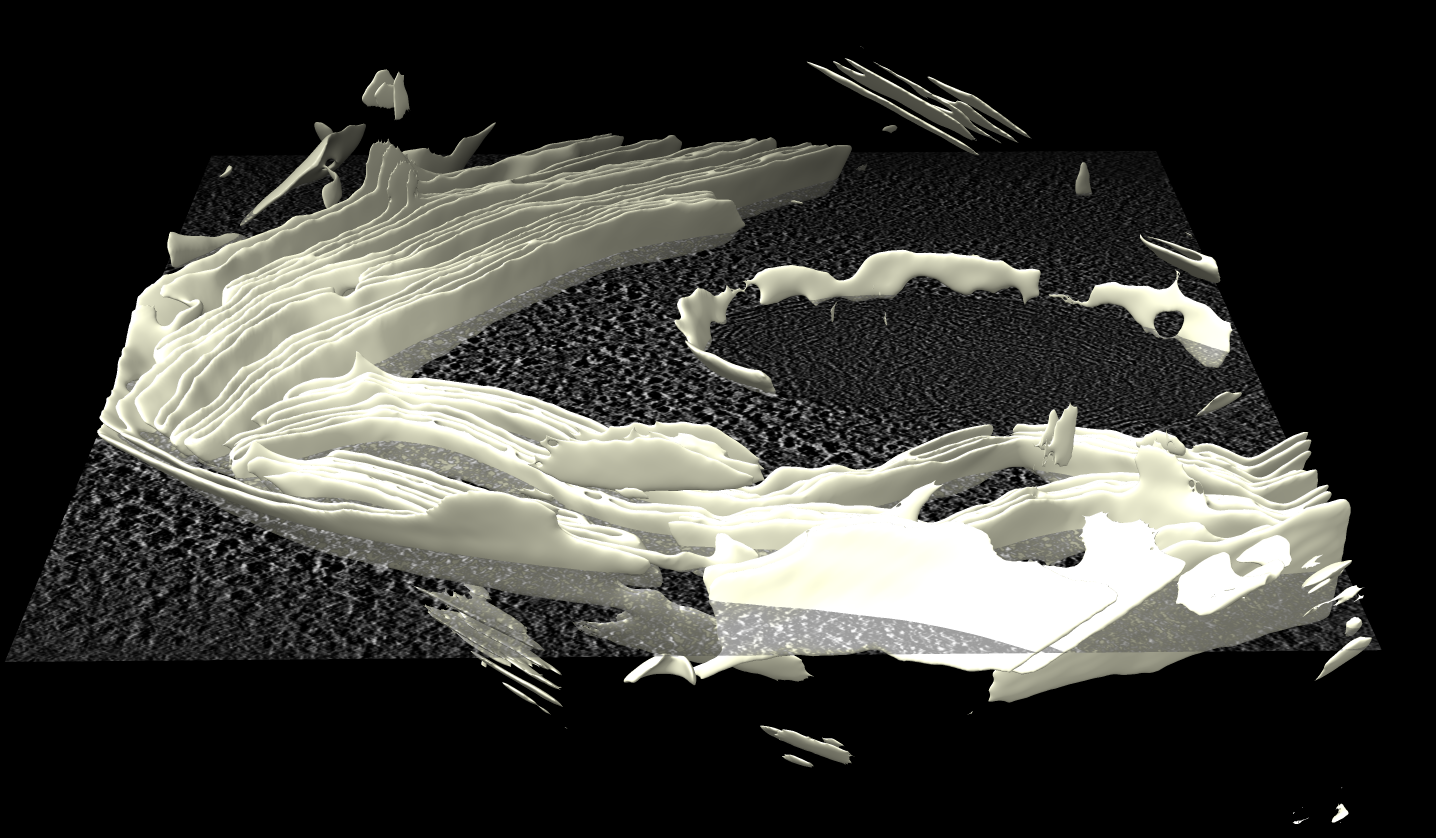
Smoothed membrane surface.
Tom Goddard
June 17, 2024
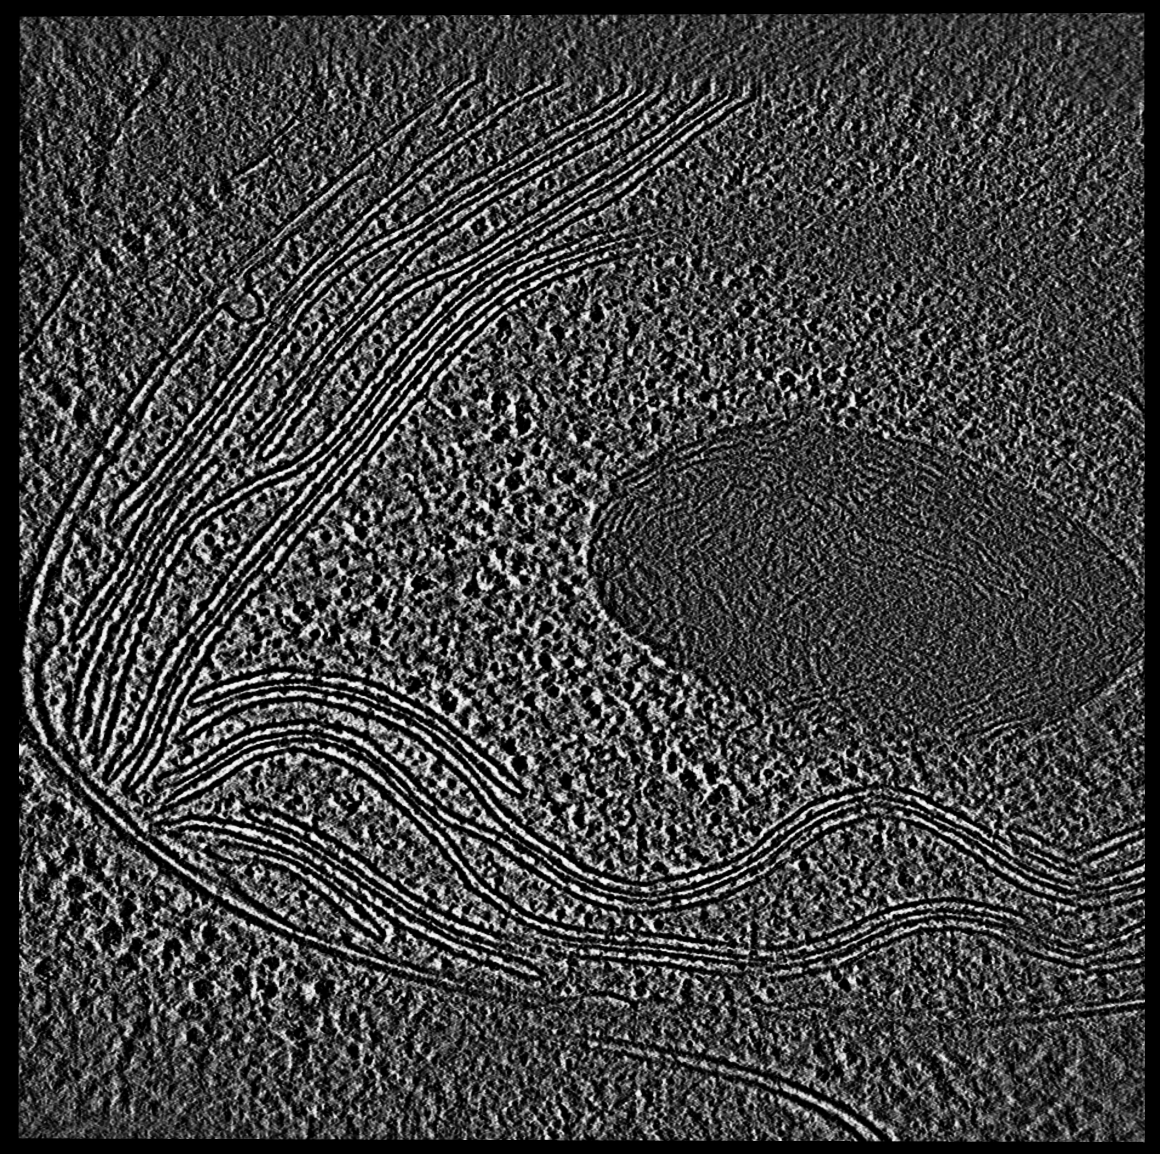
Here we show a way to inspect molecular complexes near membranes in cryoEM tomograms using orthogonal planes. An alternative is to visualize membrane complexes using surfaces.
We will look at ATP synthase in thylakoid membranes in tomogram EMDB 10780.
I used membrain-seg package to segment the membranes. This segmentation method uses a machine learning approached based on a U-net architecture. I installed it and ran it following these instructions without doing any preprocessing on EMDB 10780 using version 10 network parameters (MemBrain_seg_v10_alpha.ckpt).
membrain segment --tomogram-path emd_10780.map --ckpt-path MemBrain_seg_v10_alpha.ckpt --out-folder .
This software uses PyTorch which is fastest using Nvidia graphics and CUDA. But I first tried it on a 2024 Mac Studio Max M2 Ultra that looked like it would take 10 hours, so I then ran it on Ubuntu 22.04 with Nvidia RTX 4090 graphics which took about 5 minutes.

Membrane mask with jagged surface. | 
Smoothed membrane surface. |
The membrain segmentation software produces a mask that is the same grid size as the tomogram with 0 and 1 values. To make a smooth surface we can display the mask using a contour surface in ChimeraX and then smooth it. After opening in ChimeraX the mask does not align with the emd_10780.map apparently because the membrain-seg code ignores the origin index which is 0,0,-232 (as seen using menu Tools / Volume Data / Map Coordinates) in ChimeraX. Setting the origin of the mask to match the map and displaying surface style and showing the full volume (initially it just shows one plane in ChimeraX) and setting the contour level at 0.5 and showing every other grid point can be done with this ChimeraX command, followed by a command to create the smooth surface as an STL file
      volume #2 originIndex 0,0,-232 style surface region all level 0.5 step 2
      surface smooth #2 iterations 50
      save emd_10780_membrane.stl model #3
Making a smooth membrane surface is important because we will use the normal vectors to the surface to align a particle picking box to the surface, and also to project nearby density onto the surface. While we could use the full resolution mask (step 1) that creates of large mask file (500 Mbytes, 10 million triangles) that slows down picking slightly and step 2 gives a very smooth surface that is 1/4 the size.

Projected slab density 4 to 10 nm from membrane onto membrane |
One way to visualize molecular complexes sticking out of the membrane is to average the density in a layer outside the membrane and color the membrane surface using the average value. The average density is projected along the normal vectors to the surface. The color sample command "offset" option added in ChimeraX 1.8 can do this. In the following example density from 40 to 100 Angstroms from the membrane surface sampled at 10 Ansgstrom intervals is used (option "offset 40,100,10").
color sample #2 map #1 palette -40,black:40,white offset 40,100,10
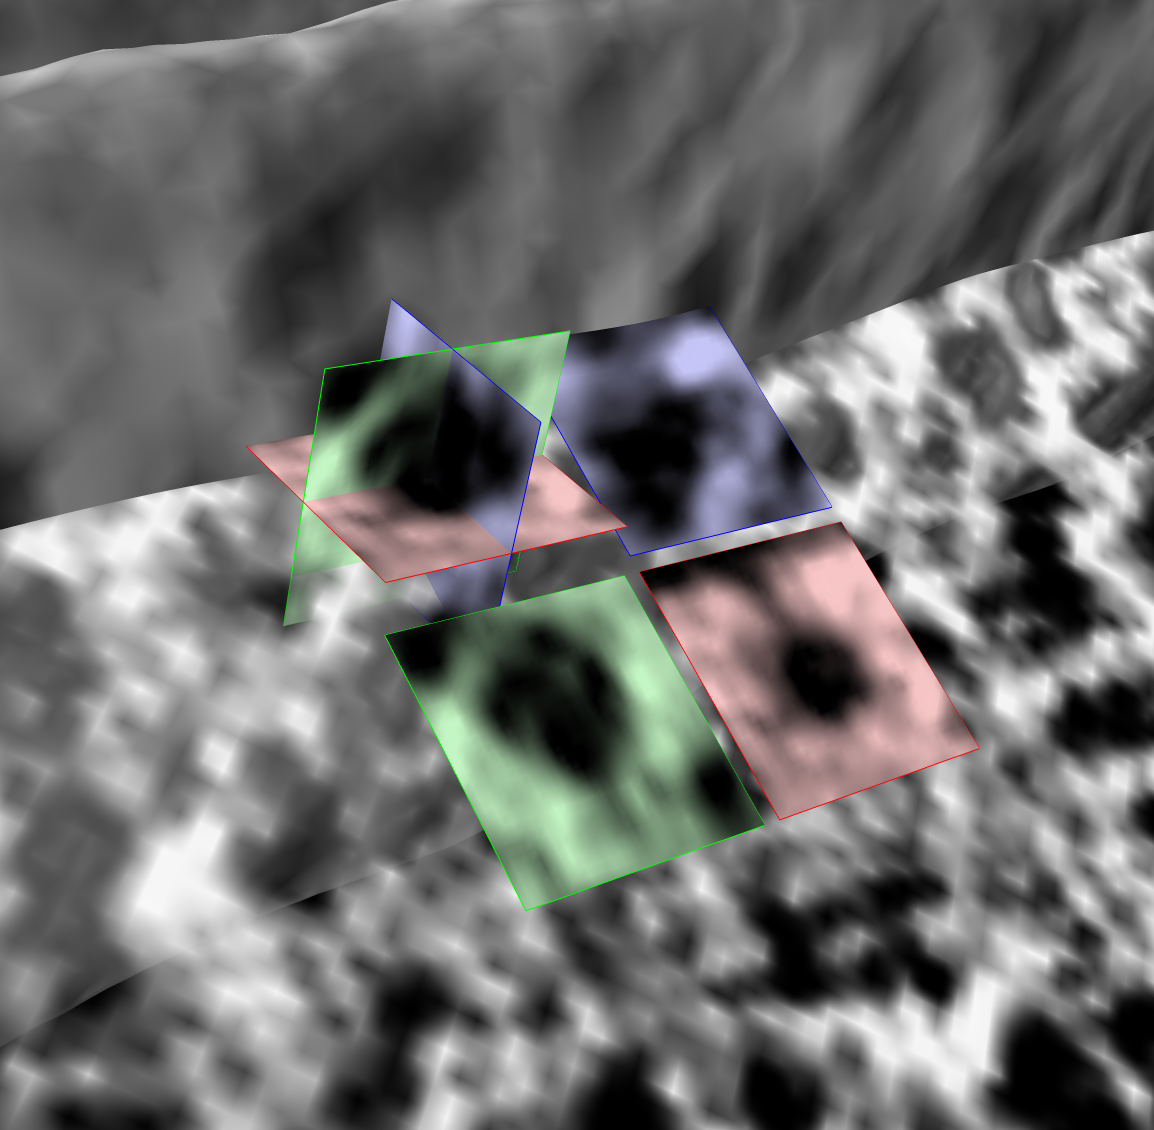
Pick near membrane. | 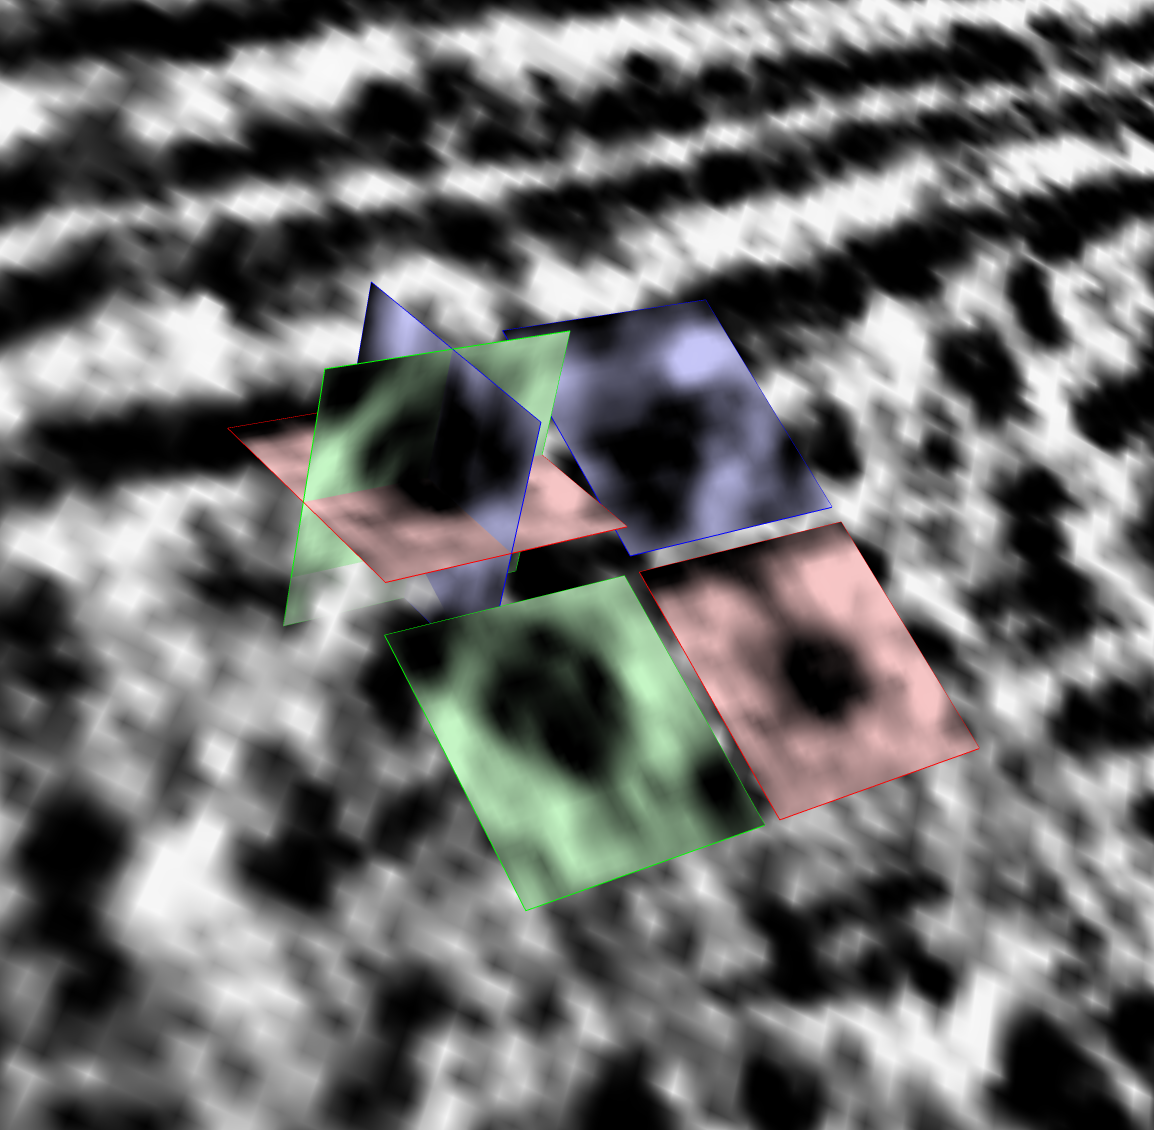
Surface hidden. | 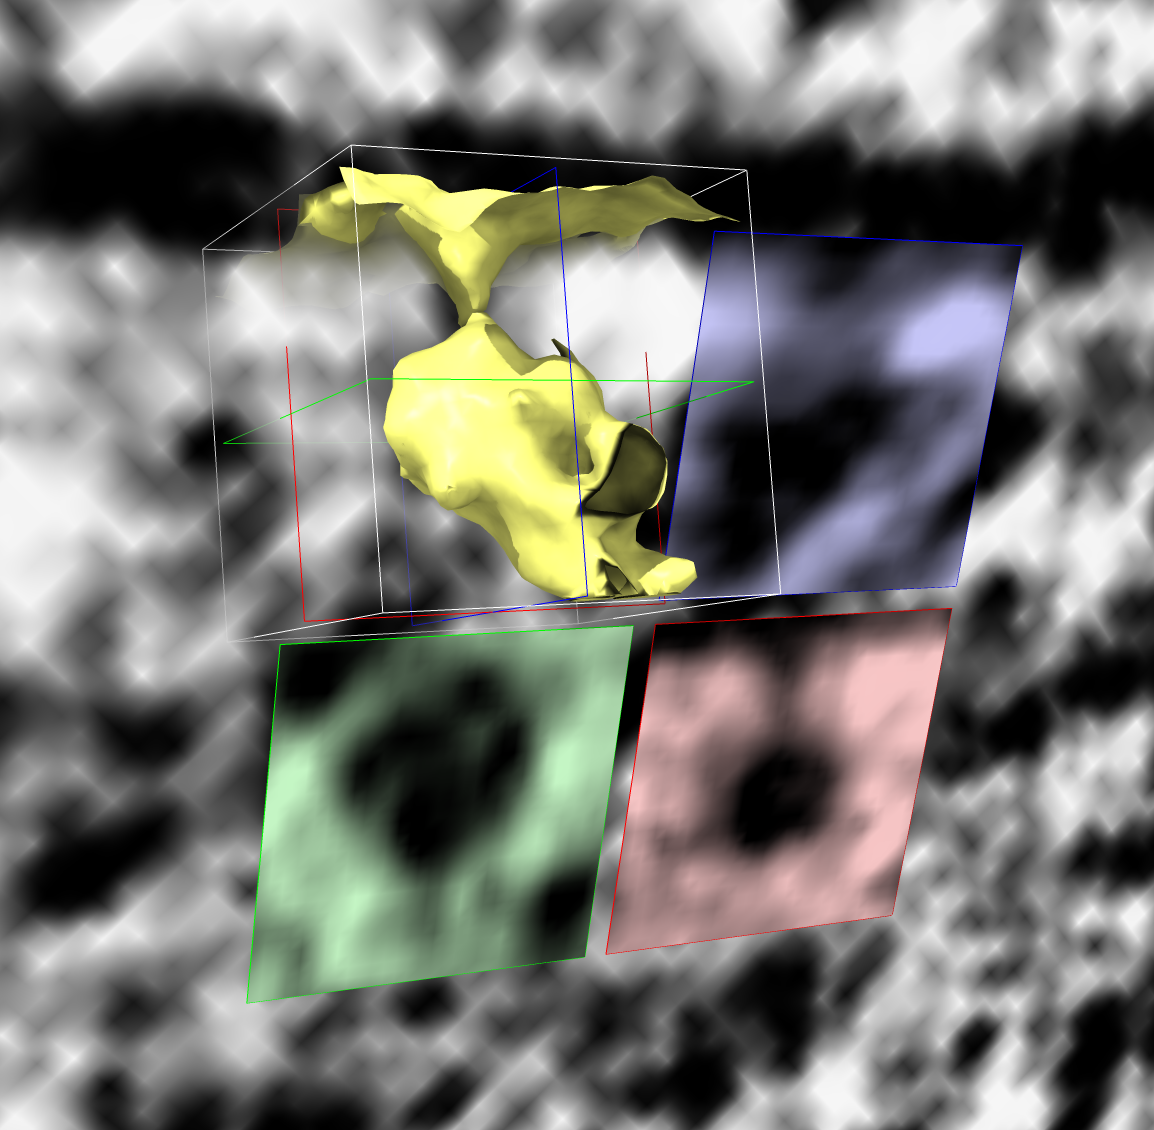
Particle surface. | 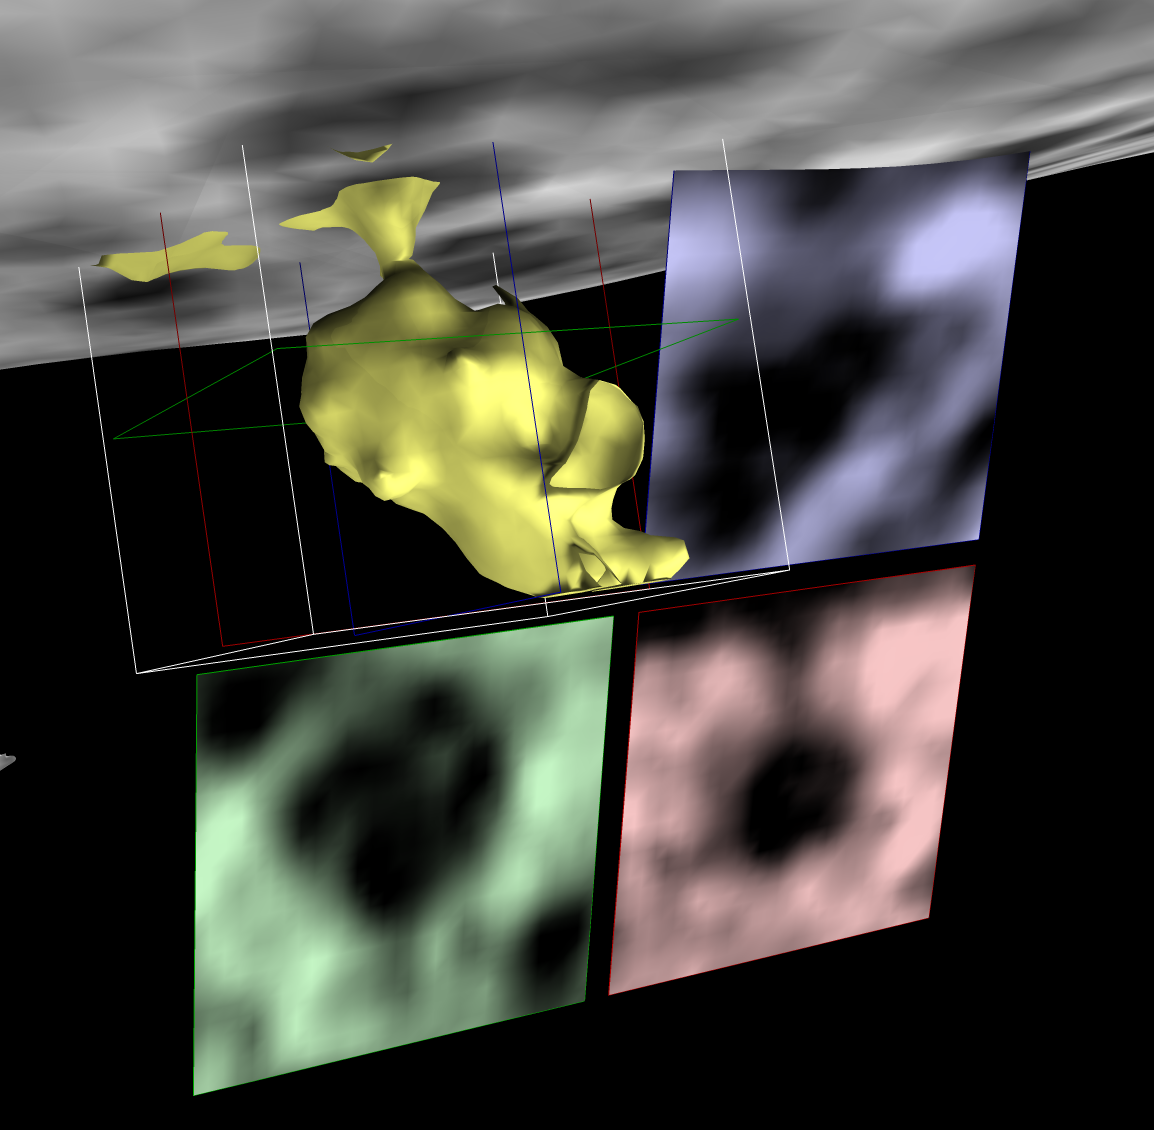
Particle and membrane. |

| |||
To inspect possible molecular complexes near the membrane in xy, yz and xz planes there is a ChimeraX orthopick mouse mode (added June 18, 2024, not in version 1.8) that can be assigned to the right mouse button with
mouse right orthopick
An icon to enable this mode can be added to the Toolbar Home tab by right clicking on blank space in the toolbar and selecting Settings....
A right click on a tomogram plane shows 3 orthogonal planes centered at the clicked point colored by the density and also shows copies of these 3 planes all parallel the map z slices for easy viewing without rotating.
Moving planes: The red plane (cryoEM beam aligned xy), green plane (xz) and blue planes (yz) can be dragged with the orthopick mode to see different cross-sections.
3D particle surface: The orthogonal set of planes can be replaced by a 3D contour surface of the particle using the "Show particle surface" button in the Orthopick Settings panel which appears when the mouse mode is enabled. The contour level can be changed by pressing and dragging the orthopick mouse button on the particle surface.
Recentering box: The box can be recentered by dragging on the red, green or blue planes with the shift key held down. The box can be resized using the "Particle Size" entry field in the Orthopick Settings panel.
Average slab density: The coloring on the planes can use the average density in a slab of a specified thickness centered at the plane position.
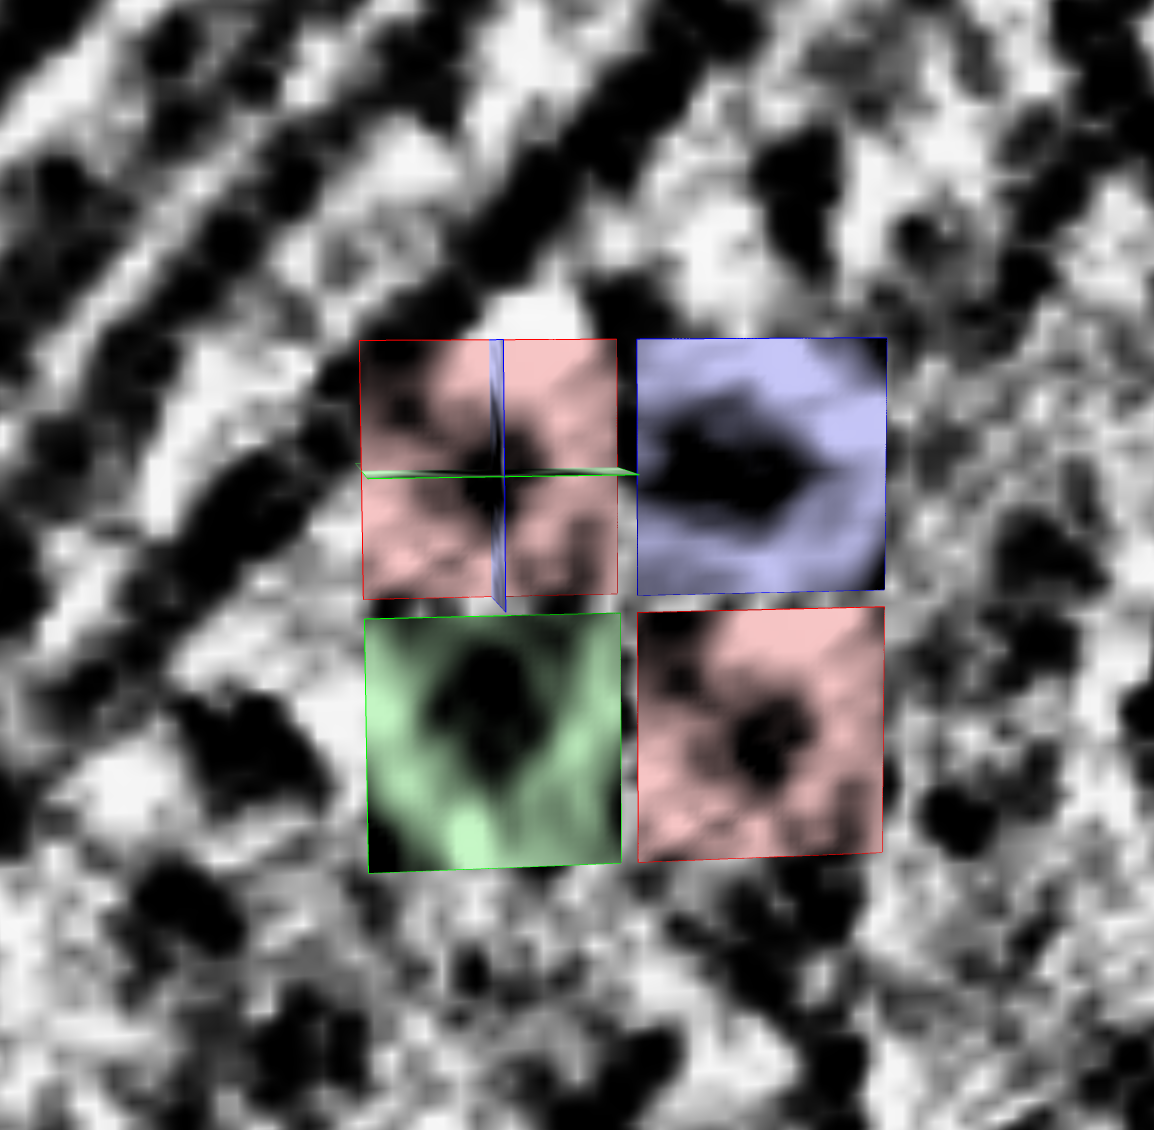
Pick not aligned to membrane surface |
Picking without membrane surfaces: You can pick particles without having a membrane surface segmentation. In that case the box will not align to the membrane and will instead align to the xyz axes of the tomogram.
Saving particle density: The density in the particle box aligned to the membrane can be saved to an MRC file with the "Save particle map" button. It saves a file to the Desktop named particleN.mrc. The MRC file saves the origin so that reopening that file will position it correctly in the tomogram. But the MRC format does not have header values for a rotation. ChimeraX saves the rotation information in an MRC header label so ChimeraX will open it with the right rotation. But other software will not recognize the rotation.
Here are my impressions of the above visualization tools based on a little bit of use.
Particle about 6 pixels in diameter |