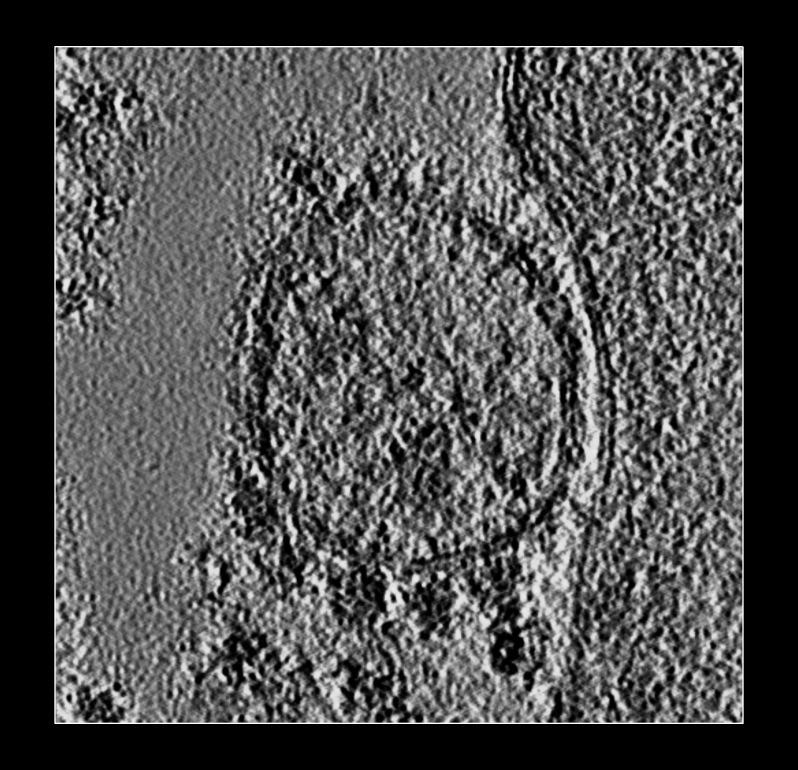
Lysosome with 5 membrane
complexes on bottom side.
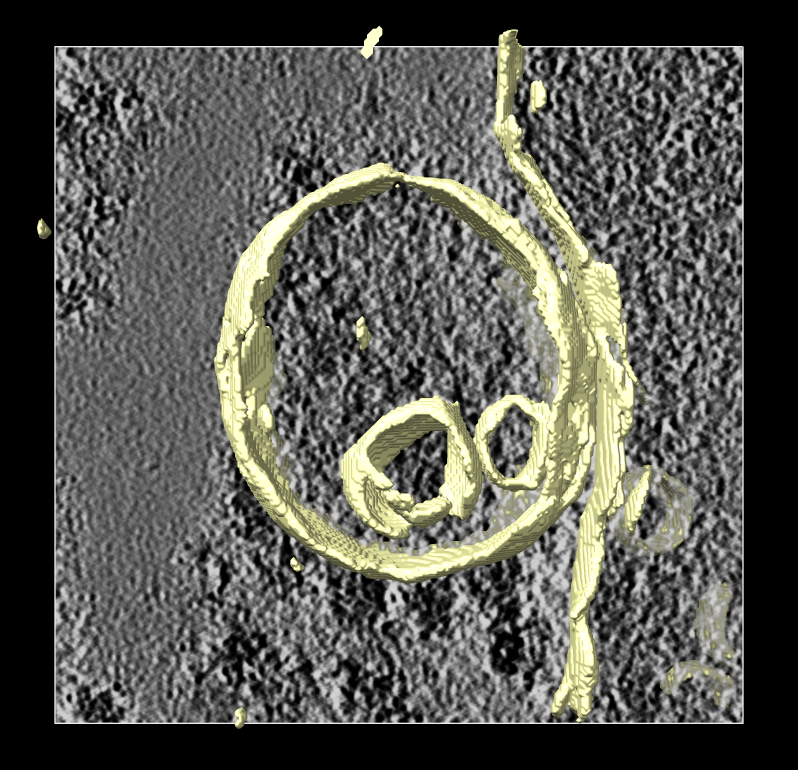
Segmentation mask of membranes
shown in yellow.
Tom Goddard
June 18, 2024
We go through how to show surfaces of molecular complexes seen on membrane surfaces in cryoEM tomograms. Because the tomograms are noisy we will look at just a layer near a segmented membrane and smooth the density and hide small connected surfaces that are noise. An alternative for visualizing membrane proteins is to use orthogonal slices.

Lysosome with 5 membrane complexes on bottom side. | 
Segmentation mask of membranes shown in yellow. |
We try to display V-ATPases sticking out from lysosome membrane surfaces. Here is a part the tomogram lysosome.mrc from the Chan-Zuckerberg Imaging Institute.
We will use a segmentation lysosome_membranes.mrc of the membranes in the tomogram created with membrain-seg using command
      membrain segment --tomogram-path lysosome.mrc
               --ckpt-path MemBrain_seg_v10_alpha.ckpt --out-folder .
Open these in ChimeraX (using version 1.8)
      open lysosome.mrc
      open lysosome_membranes.mrc

Lysosome surface colored. | 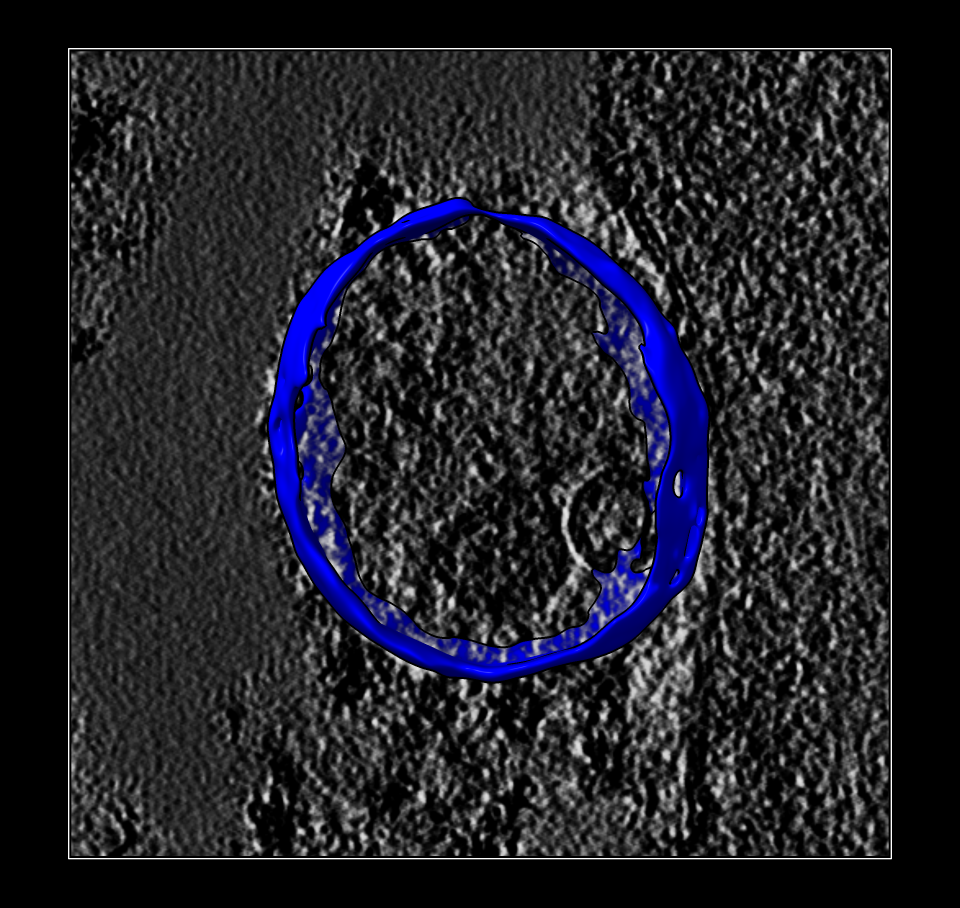
Lysosome surface separated. |
The segmentation of the membrane is mask with 0 and 1 values so the surface of this mask has stair-step artifacts. First we'll make a smooth version of this surface in ChimeraX.
      volume #2 step 1 level 0.5
      surface smooth #2 iterations 100
To separate just the lysosome surface we use the Right Mouse Toolbar tab and click the Blob mouse mode, then click with the right mouse button on the lysosome membrane to give it a new color (blue). Then we split the surface into the blue and yellow part with the "surface splitbycolor" command. We can save the lysosome surface to a file lysosome_surface.stl
      surface splitbycolor #3
      save lysosome_surface.stl model #4.1
We invert the map so the density for membrane and complexes have positive values. Then we mask to a range of about 30 nm from the membrane (60 grid points since pixel size is 0.5 nm). Then smooth the map. Then hide small surface blobs. Using the Blob mouse mode we can color the membrane complexes different colors by clicking on each.
      volume scale #1 factor -1e5
      volume mask #5 surface #4.1 extend 60
      vol gaussian #6 sdev 25
      surf dust #7 size 200
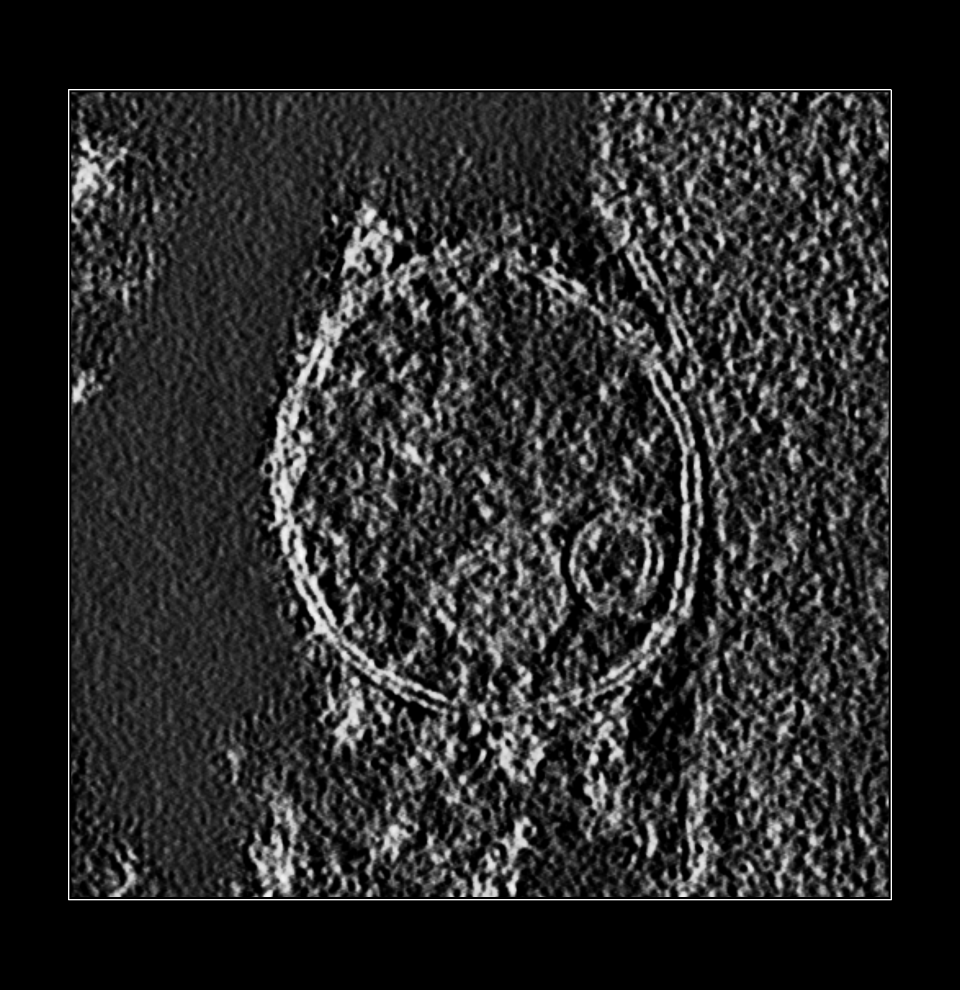
Tomogram inverted. | 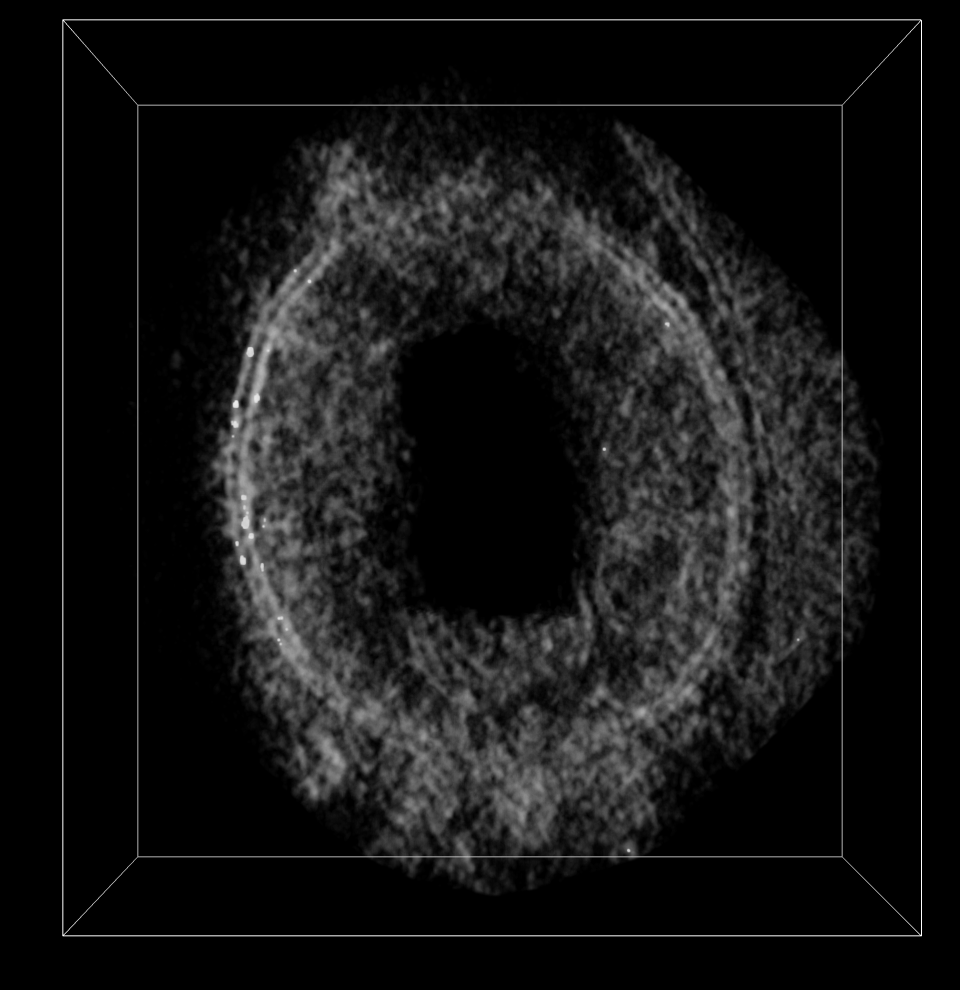
Masked to layer near membrane. | 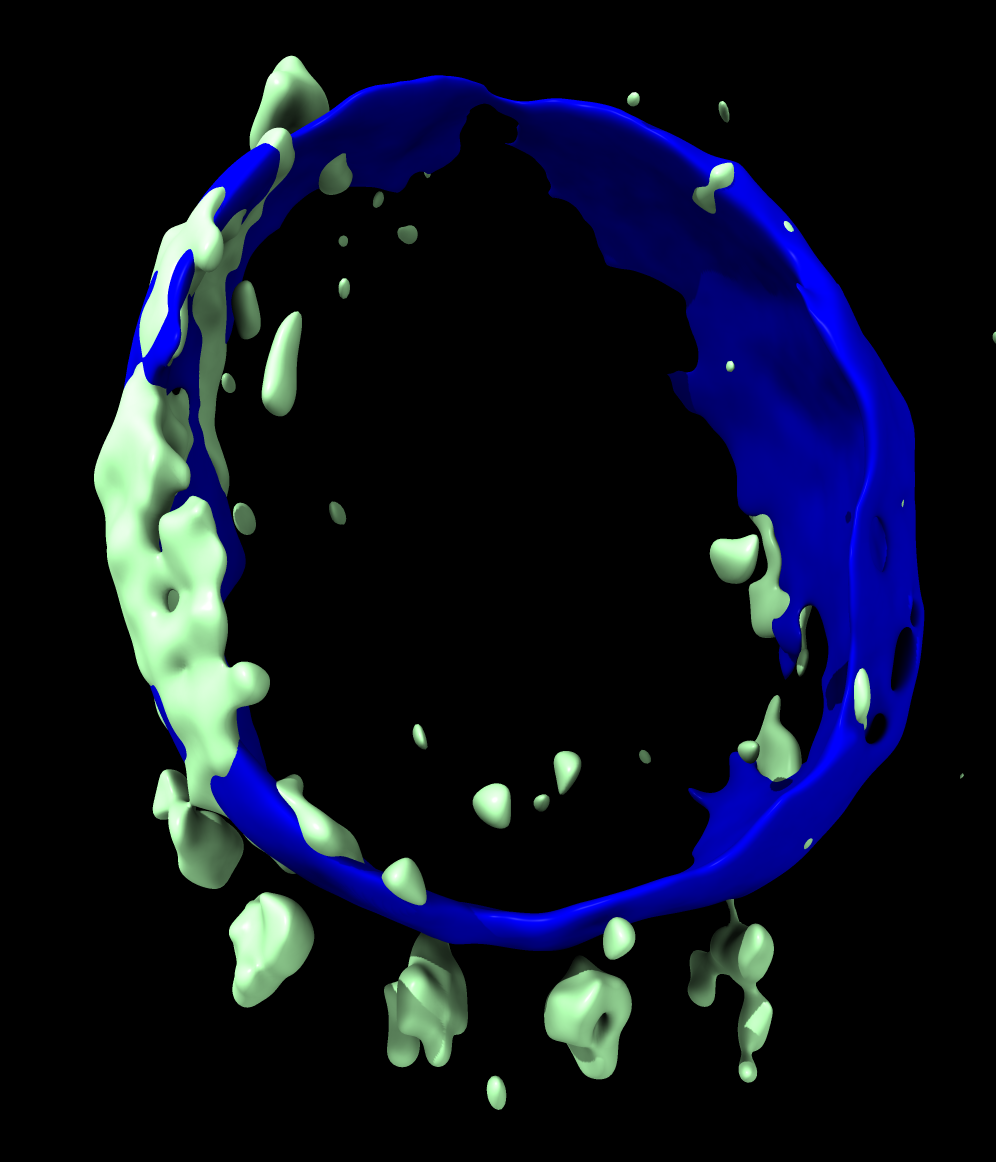
Smoothed density. | 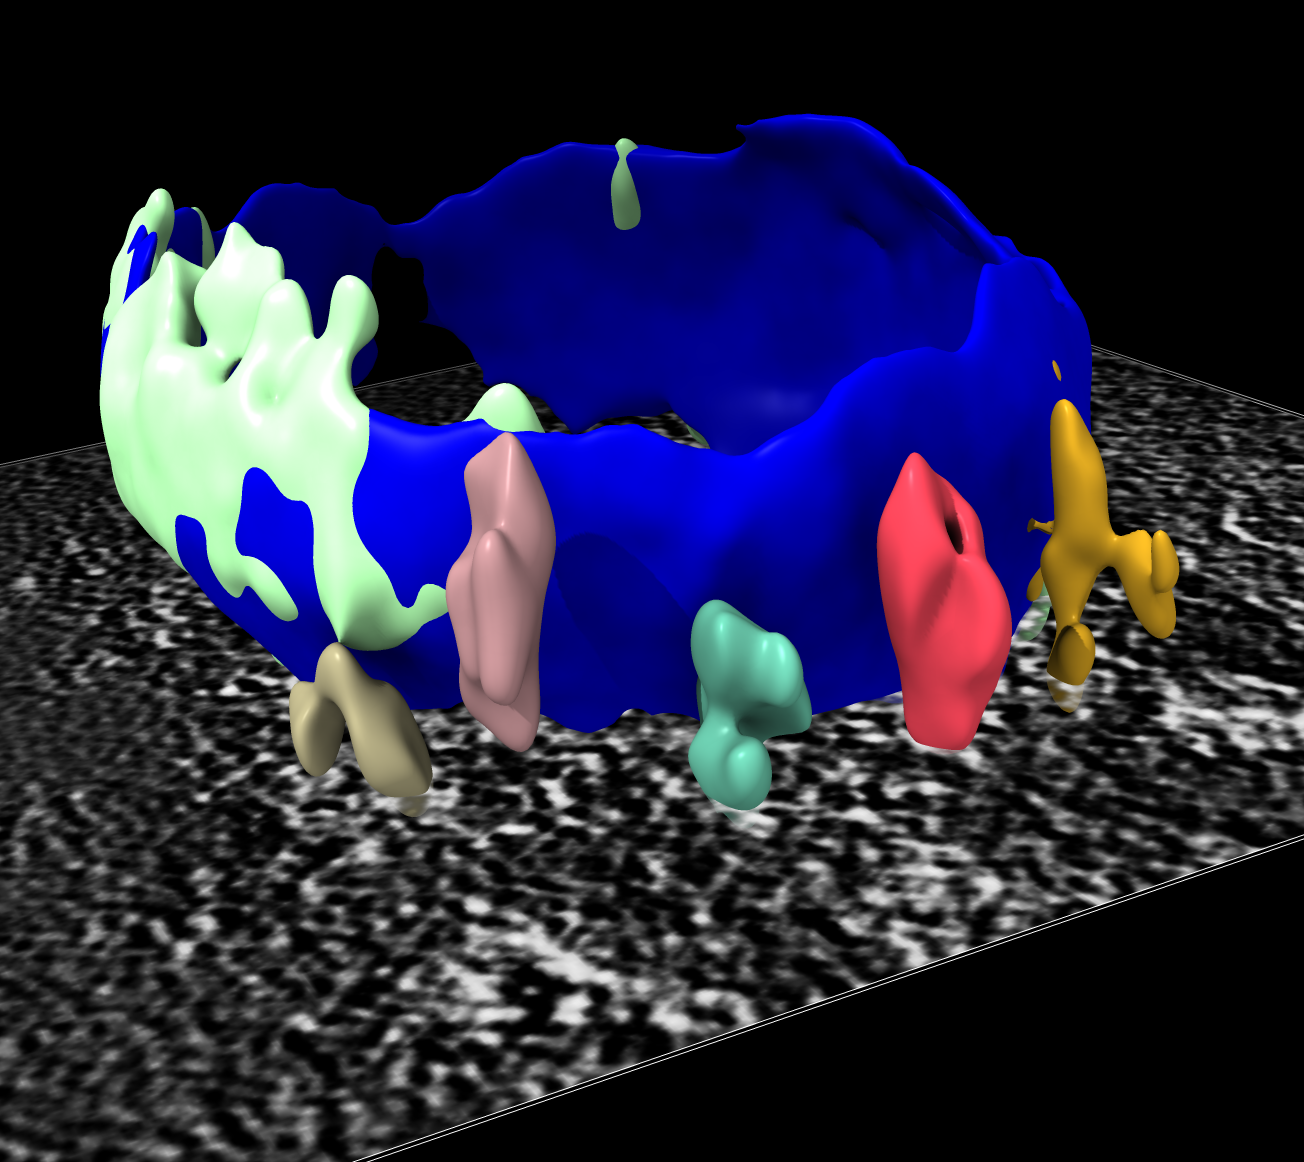
Dust hidden, particles colored. |