Tom Goddard
May 2, 2024
Here are a couple attempts to improve the visibility of membrane complexes in electron tomograms in ChimeraX. These tests led to development of the ChimeraX orthopick mouse mode.
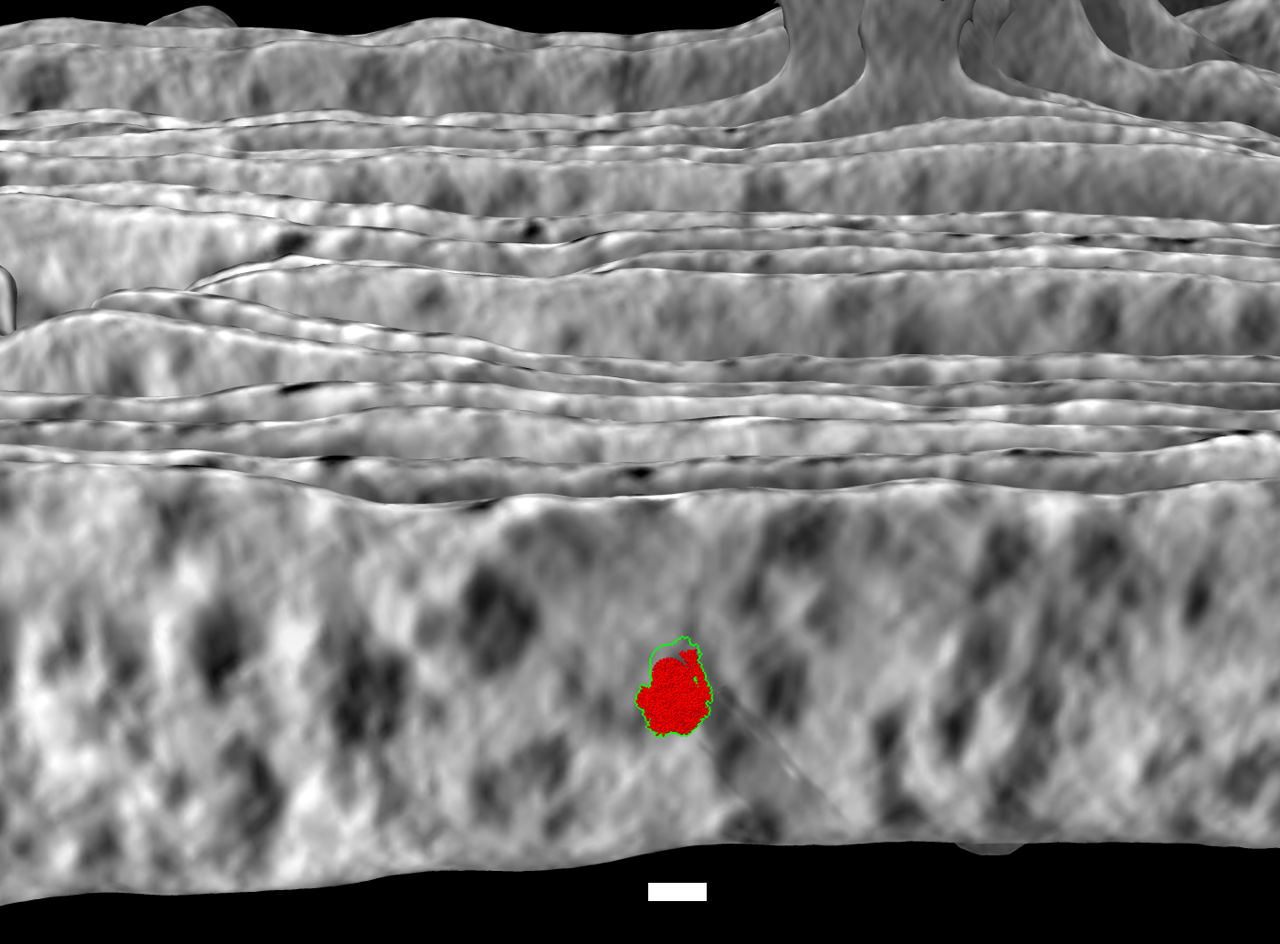
I added an option to ChimeraX to project the average tomogram value from a range of distances from the membrane surface onto the surface along normal vectors. The membrane surface was segmented using membrain-seg as described here. Below is an example image for thylakoid tomogram EMDB 10780 using range 4 to 10 nm colored with ChimeraX color sample command
color sample #5 map #1 palette -40,black:40,white offset 40,100,10
The red is ATP synthase atomic model PDB 6fkf to indicate the size of the expected complex and the white scalebar is 10 nm.

|
The offset option takes a starting offset, ending offset and step size (in Angstroms). So this command averages map values 4 -10 nm from the surface in steps of 1 nm. This new offset option with 3 values is in ChimeraX 1.8 and newer. For comparison I made an animation showing projecting at 4 nm, then 5 nm, ... then 10 nm, then oscillating back from 10 to 4 nm so you can see the density at varying distances. The average does provide a simpler picture.
I tried summing 2, 4, 8, or 16 z-planes and displaying on a single plane to look for improved signal to noise of ATP synthase in chloroplast tomogram EMD 10780. Summing planes had no benefit that I could see for this tomogram where the complexes are already easily seen in a single plane of the 4x binned tomogram.
Three ATP synthases seen in middle of image. Sum of 2, 4, 8, or 16 planes projected onto a single plane. Voxel size is 13.68 Angstroms, so 8 planes is about 10 nm. By 16 planes we are summing 20 nm which is twice the diameter of the ATP Synthase F0 head so we are just reducing the signal to noise by adding 10 nm of non-ATP-synthase planes.

| 
| 
| 
| 
|