

 about
projects
people
publications
resources
resources
visit us
visit us
search
search
about
projects
people
publications
resources
resources
visit us
visit us
search
search
Quick Links
Featured Citations
CryoET of β-amyloid and tau within postmortem Alzheimer's disease brain. Gilbert MAG, Fatima N et al. Nature. 2024 Jul 25;631(8022):913–919.
Structure and topography of the synaptic V-ATPase-synaptophysin complex. Wang C, Jiang W et al. Nature. 2024 Jul 25;631(8022):899–904.
Multiscale photocatalytic proximity labeling reveals cell surface neighbors on and between cells. Lin Z, Schaefer K et al. Science. 2024 Jul 19;385(6706):eadl5763.
Phage anti-CRISPR control by an RNA- and DNA-binding helix-turn-helix protein. Birkholz N, Kamata K et al. Nature. 2024 Jul 18;631(8021):670-677.
Inhibition of M. tuberculosis and human ATP synthase by BDQ and TBAJ-587. Zhang Y, Lai Y et al. Nature. 2024 Jul 11;631(8020):409–414.
More citations...News
August 1, 2024
Planned downtime: The ChimeraX website, Toolshed, web services (Blast Protein, Modeller, ...) and cgl.ucsf.edu e-mail will be unavailable August 1, 3-6 pm PDT.
June 17-18, 2024
Planned downtime: The ChimeraX website, Toolshed, web services (Blast Protein, Modeller, ...) and cgl.ucsf.edu e-mail will be unavailable June 17-18 PDT.
June 13, 2023
The ChimeraX 1.8 production release is available! See the change log for what's new.
Previous news...Upcoming Events
UCSF ChimeraX (or simply ChimeraX) is the next-generation molecular visualization program from the Resource for Biocomputing, Visualization, and Informatics (RBVI), following UCSF Chimera. ChimeraX can be downloaded free of charge for academic, government, nonprofit, and personal use. Commercial users, please see ChimeraX commercial licensing.
ChimeraX is developed with support from National Institutes of Health R01-GM129325, Chan Zuckerberg Initiative grant EOSS4-0000000439, and the Office of Cyber Infrastructure and Computational Biology, National Institute of Allergy and Infectious Diseases.
Feature Highlight

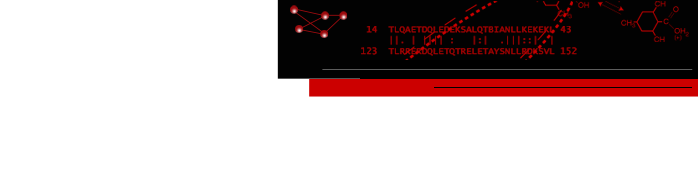
Modeller Comparative is an interface to Modeller for comparative (“homology”) modeling of proteins and protein complexes.
The example shows modeling the human (shades of blue) from the mouse (brown and tan) complex of programmed death-1 (PD-1) with its ligand PD-L2, PDB 3bp5.
Comparative modeling requires a template structure and a target-template sequence alignment for each unique chain. The sequences of human PD-1 and PD-L2 targets were fetched from UniProt and associated with the corresponding chains in the template structure, see model-pdl-setup.cxc. (Pairwise or multiple sequence alignments could have been used, but in this case, the template structure was simply associated with the target sequence.) Sequence-structure association shows mismatches in the Sequence Viewer: pink boxes for sequence differences between mouse and human, and gray outlines around the parts missing from the structure.
Three models were made with with default settings (other than the number of models), and the best-scoring model is shown. Two positions where sequence differences change the interfacial H-bonds are displayed.
More features...Example Image

Atomic B-factor values are read from PDB and mmCIF input files and assigned as attributes that can be shown with coloring and used in atom specification. This example shows B-factor variation within a structure of the HIV-1 protease bound to an inhibitor (PDB 4hvp). For complete image setup, including positioning, color key, and label, see the command file bfactor.cxc.
Additional color key examples can be found in tutorials: Coloring by Electrostatic Potential, Coloring by Sequence Conservation
About RBVI | Projects | People | Publications | Resources | Visit Us
Copyright 2018 Regents of the University of California. All rights reserved.