


cddApp Tutorial
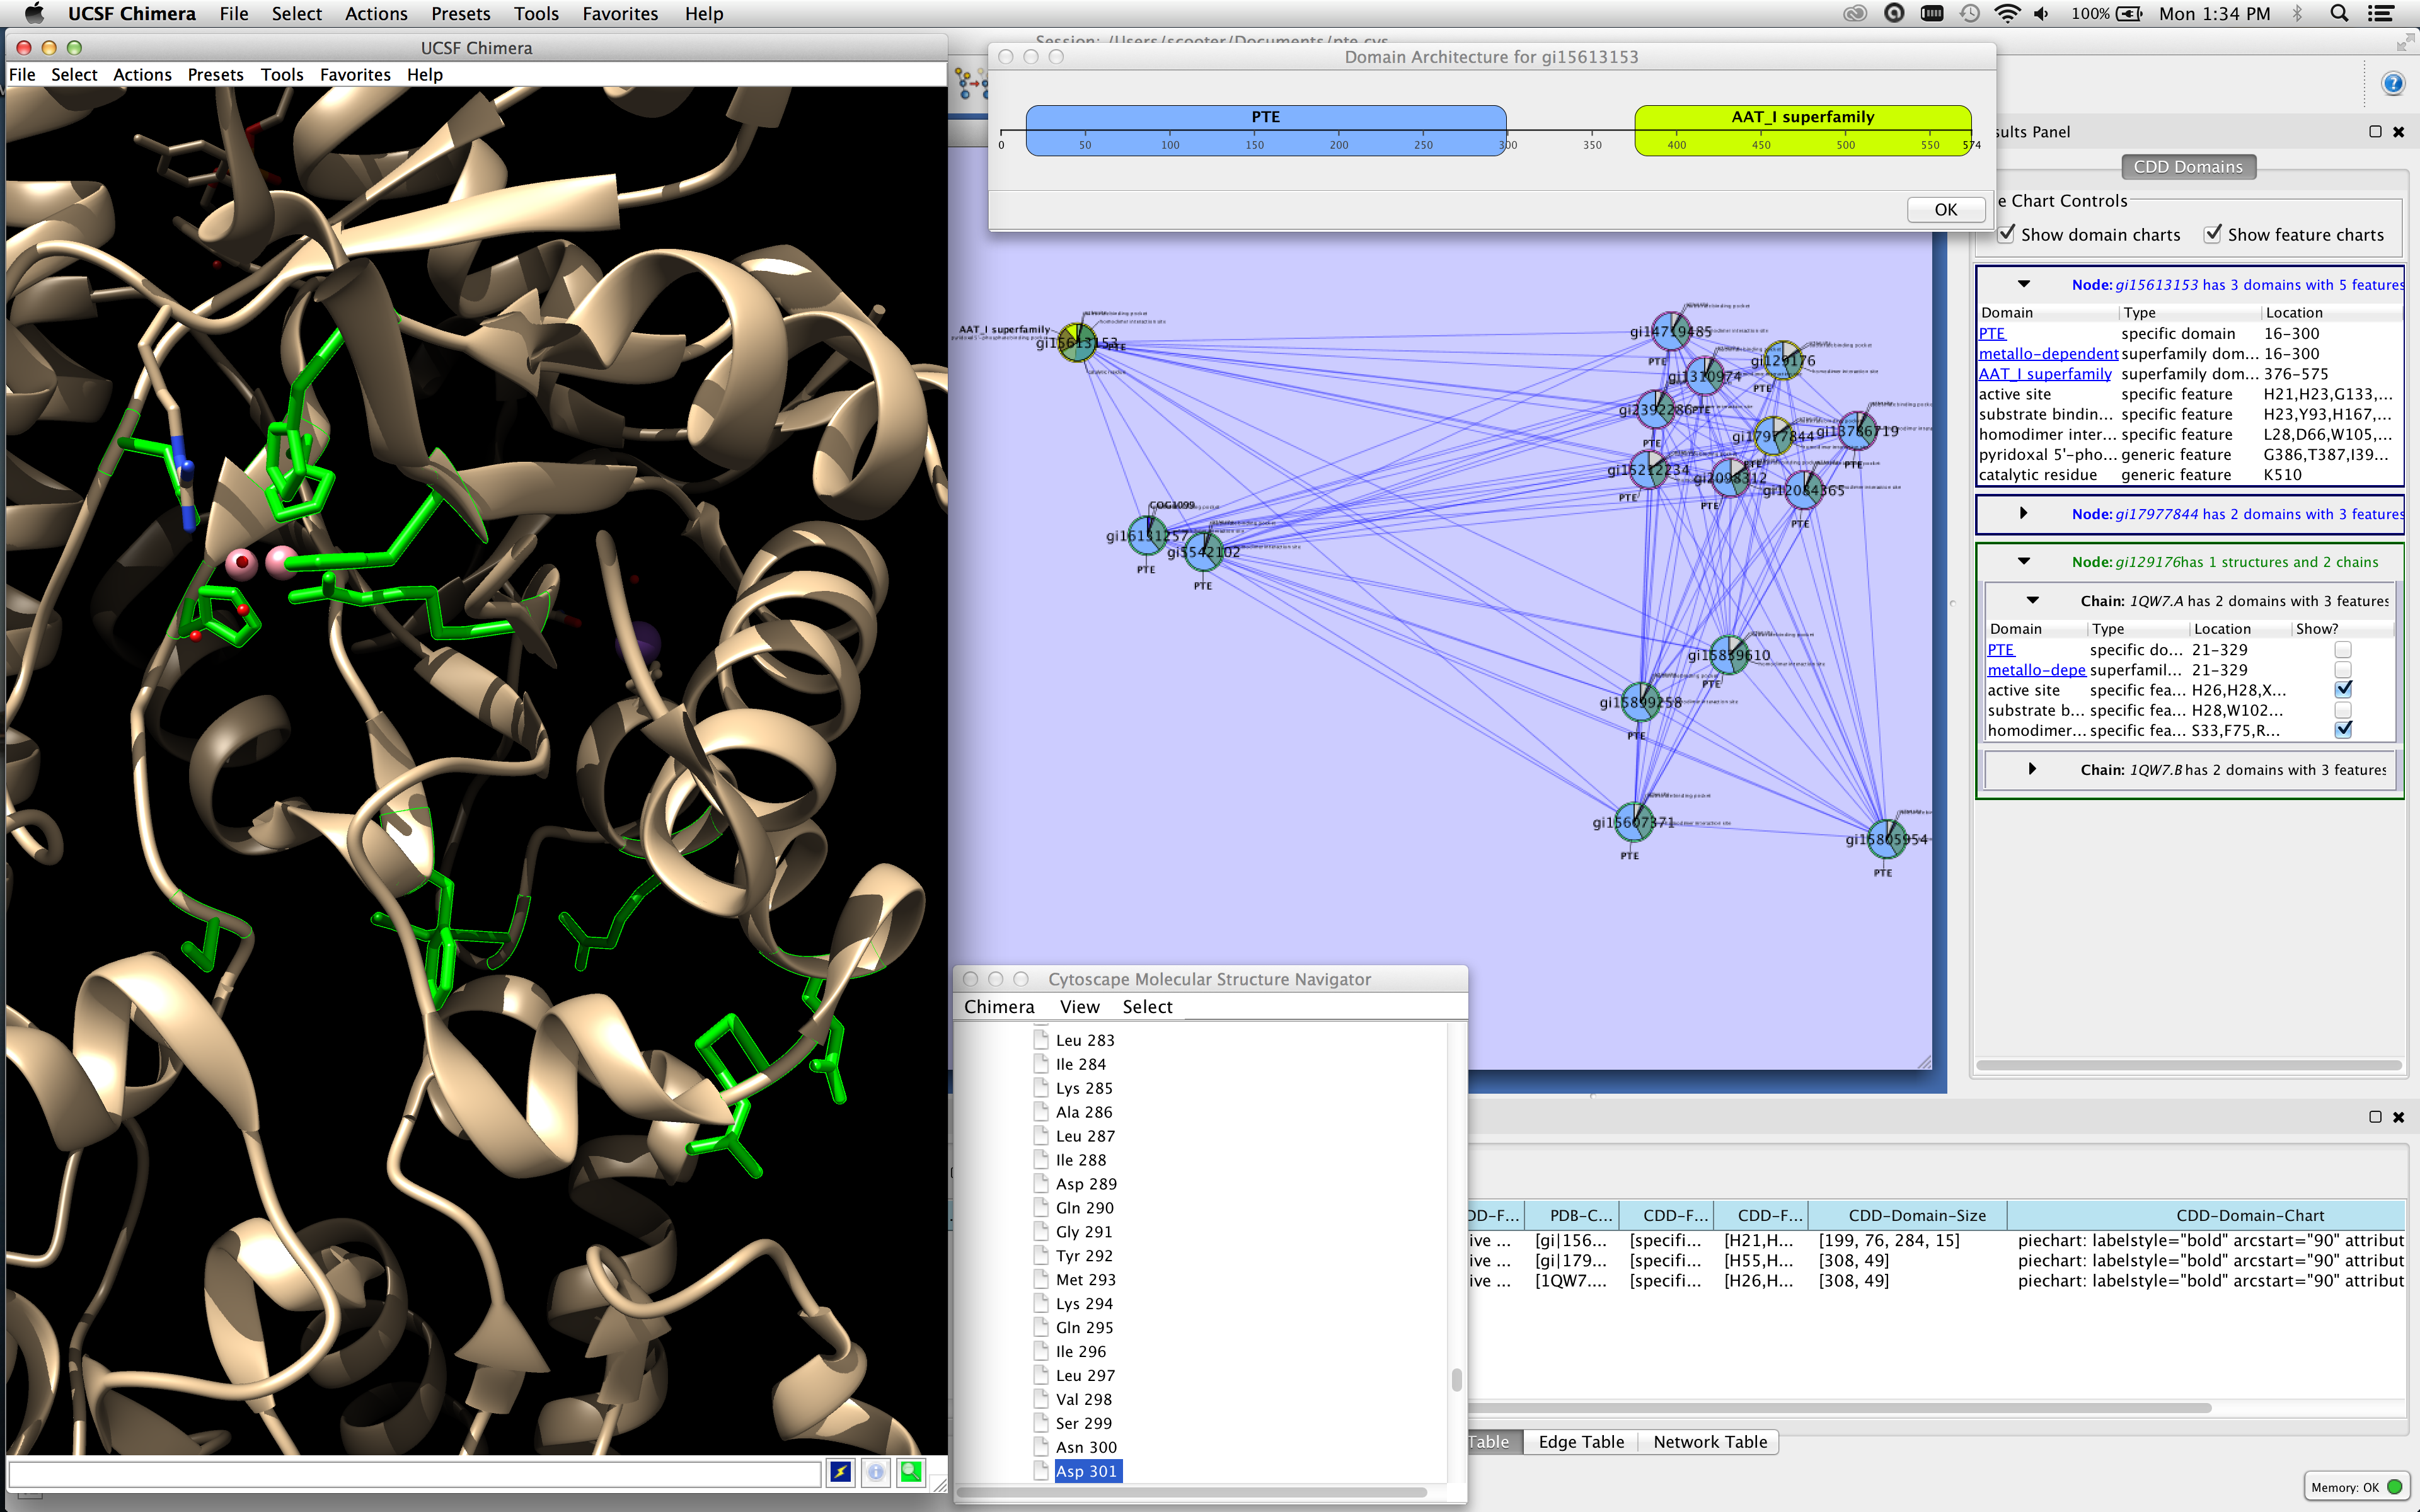
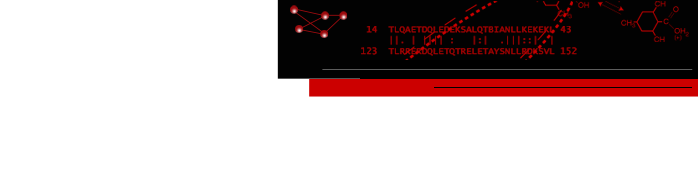
Figure 1. This screenshot of Cytoscape with cddApp installed shows the CDD Domains tab in the Cytoscape Results (right side of figure) panel with three nodes selected. The bottom node (in green) is associated with two chains and the top two nodes (in blue) do not have PDB structures. cddApp utilizes the Cytoscape apps enhancedGraphics and structureViz2 to paint pie charts on nodes and to show the domain and site information on the structure, respectively. The active site and homodimer interface are shown in UCSF Chimera's graphics window (left side of figure). The domain architecture for top node is shown at the top of the network.
cddApp is a Cytoscape3 extension that supports the annotation of protein networks with information about domains and specific functional sites (features) from the National Center for Biotechnology Information (NCBI) Conserved Domain Database (CDD). CDD information is loaded for nodes annotated with GI numbers or UniProt Identifiers and (optionally) PDB structures. cddApp integrates with the Cytoscape apps structureViz2 and enhancedGraphics. Together, these three apps provide powerful tools to annotate nodes with CDD domain and site information and visualize that information in both network and structural contexts.
Installation
cddApp, structureViz2 and enhancedGraphics are available through the Cytoscape App store or the App Manager in Cytoscape.
- Install Cytoscape 3.1 or newer. Go to the Cytoscape web site and click on the Download button on the front page. Fill out the information and accept the terms of use. Download the latest Cytoscape for your platform. You will need to have Java 6 or Java 7 installed on your computer already. Once downloaded, double-click on the download to run the installer and install the program on your machine.
- Download and install UCSF Chimera. Go to the UCSF Chimera web site and click on the Download link on the left. Download the appropriate installer for your platform and double-click on it to install.
- Install cddApp. Start the Cytoscape downloaded in the step above. Then leaving Cytoscape running, open up a web brower and navigate to the Cytoscape App Store. Search for cddApp in the search box at the top of the page and click on the box that comes up. You should see a blue Install button after the page loads. Click on this to load cddApp.
- Follow the same procedure as above to install enhancedGraphics and structureViz2.
- Finally, download the Sample Data Set, which we'll use to annotate with information from the CDD
Annotate the Network
The main goal of cddApp is to map information from the NCBI Conserved Domain Database (CDD) onto nodes in a Cytoscape network. There are only two requirements for this to happen. The network must have a column with an identifier understood by the CDD (GI numbers, PDB identifiers, or UniProt identifiers); and the computer must have network access to the CDD. Our sample network (pte.cys) has several columns that we can use.
Figure 2. The settings dialog for selecting the columns with the identifiers to use for CDD.
- Start the Cytoscape downloaded above.
- Open the sample session file (pte.cys) using File→Open and then navigate to where you saved pte.cys when you downloaded it above (Sample Data Set).
- Once the file is open, we can annotate it with CDD information by doing Apps→cddApp→Load CDD Domains for Network. This will bring up a small dialog (Set Column Values). Select name for the column containing the primary identifier and pdbFileName for the column containing PDB ids. Then click OK. Note that if we didn't have a column with PDB information, we would leave the second line "-- None (no PDB IDs) --". Similarly, if we only had PDB identifiers, we would set the first column to "-- None (use PDB IDs only) --" (see Figure 2).
- This can take some time to return, but once the information is loaded, you should be able to see new columns from the CDD in the node table. The details of the columns aren't important at this point -- cddApp provides easy-to-use visualizations, which we'll explore in the next section.
Figure 3. Screenshot of Cytoscape showing the Results Panel. The checkboxes for showing pie charts on the nodes are outlined in red in the figure, and the checkbox that will show the PTE domain on the 1HZY structure is outlined in blue.
Exploring Domains
- Show the Cytoscape Results Panel by doing a View→Show Results Panel.
- Add the cdd information to the Results Panel: Apps→cddApp→Show CDD Domain Panel. This should add a new tab to the Results Panel: CDD Domains. The tab will initially be empty.
- Select (click on) a node of interest in the network. Multiple nodes may be selected by sweeping them out or by using Shift-Click to add nodes. You should see information appear in the results panel (see Figure 3).
- You can explore information about individual nodes by opening up the rows (click on the triangles pointing right). This will provide information about each domain, the type of the domain, and the location of the domain. If the domain text is blue and underlined, you can click on the text to view the CDD page about that domain.
- Note that there are two types of panels for nodes. If the node name is in blue (the bottom node in the Results panel in Figure 3), then that node does not have any PDB structures assigned to it. If the node name is in green, then it does have PDB structures and there will be a separate panel for each structure and each chain within that structure. There may also be an additional column: Show? to view the domain or feature in a structural context (see below).
- The two checkboxes at the top of the panel (outlined in red in Figure 3) may be used to visualize the domains and features as pie charts on the nodes. The domain charts cover the same relative area as the domains themselves. That is, if the protein is 200 residues long, and the domain starts at residue 50 and ends at residue 150, the corresponding pie slice will begin 1/4 of the way into the node and cover 1/2 of the node. If you visualize both domain and feature charts, the feature charts are painted on top of the domain charts and are translucent. Labels for the domain charts are larger.
- Sometimes the pie charts can be somewhat cluttered, and the specific positions of the domains difficult to see. To view a more traditional sequence architecture diagram, use the node context (right-click) menu on an individual node and select Apps→cddApp→Show domain architecture diagram. This will display a simple view of the the domain architecture (see Figure 4).

Figure 4. Screenshot of the domain architecture diagram for gi 15613153.
Viewing Structures
If UCSF Chimera and the structureViz2 app are both installed and the network was annotated with CDD information using PDB ids, then for nodes that have PDB information there will be an additional column in the CDD Domains panel, marked Show?. Clicking a checkbox in this column starts UCSF Chimera, opens the corresponding 3D structure, and selects the corresponding residues in the structure (see Figure 1). In Chimera versions 1.9 and earlier, there may be a mismatch between residue numbering based on the PDB structure and that based on the sequence; use a newer version (1.10 including daily builds, or newer) to avoid this problem.Last updated on August 25, 2014
Laboratory Overview | Research | Outreach & Training | Available Resources | Visitors Center | Search