


Enhanced Graphics App
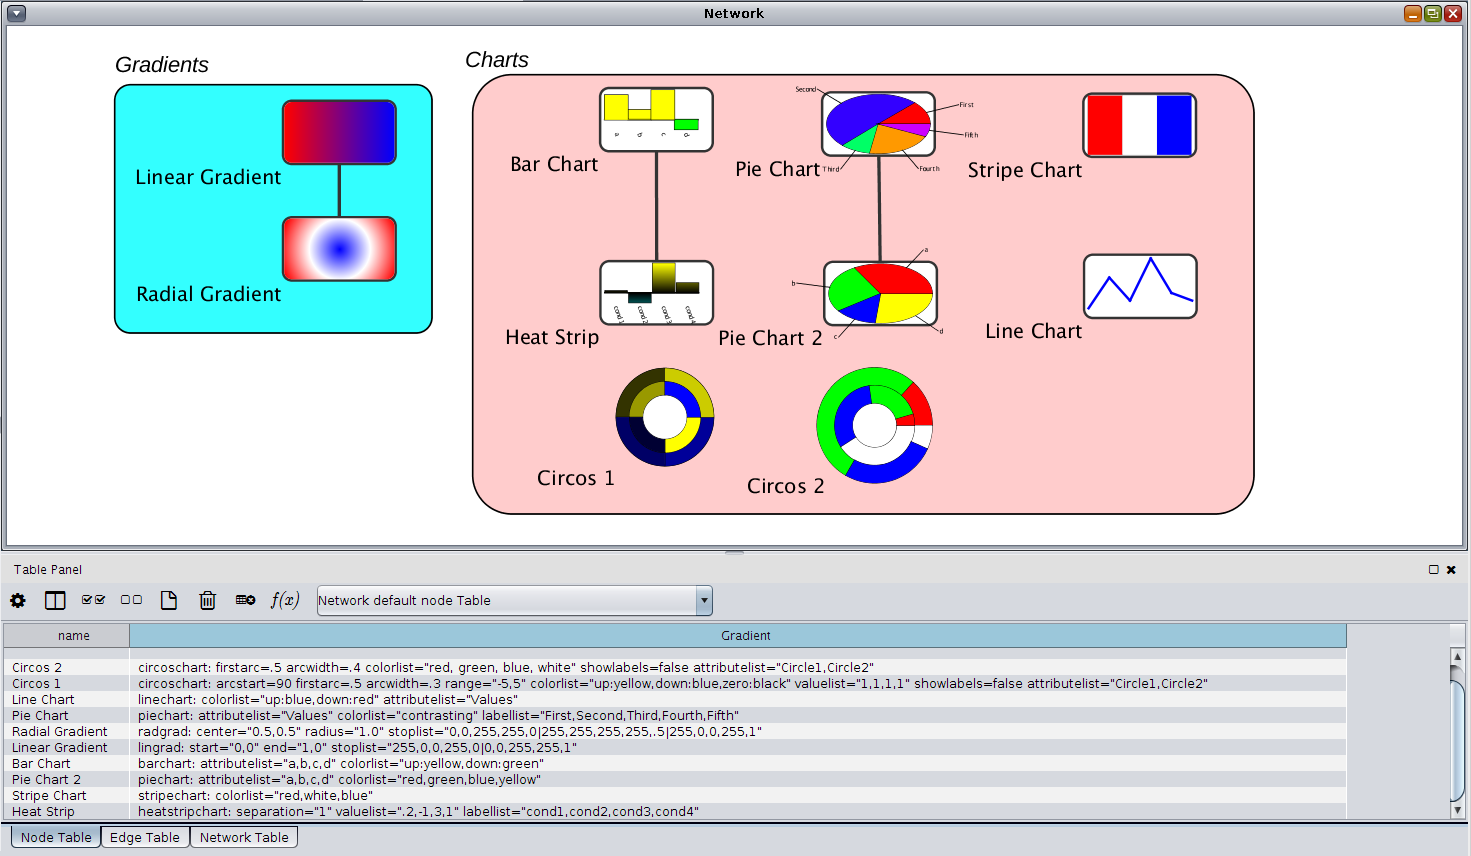
Figure 1. A simple network showing the variety of charts and graphics effects that can be painted onto nodes with the enhancedGraphics Cytoscape App.
The Enhanced Graphics App adds a set of visual style passthrough mappings for node custom graphics. These
mappings are all of the form:
type:
argument1="val1"
argument2="val2" ...
where type is the type of chart or gradient and the arguments are the instructions
for constructing that chart or graphic.
Adding the desired mappings to a column in the default node table, and creating a style that utilizes that
column to passthrough to one of the Custom Graphics visual attributes will add that graphic to the node
referenced by that row in the node table. Note that there is no requirement that nodes have the same mapping
or even the same type of mapping. Each of the individual types and their arguments are explained below.
Here are the list of types supported by the enhancedGraphics app:
- barchart
- Paints a bar chart onto the node, according to the arguments provided. The
valuelist and either node or nodelist arguments are required.
Arguments:- attributelist
- If the values are going to be specified by node attributes, this list provides the attribute or attributes to be used as a comma-separated list. You should either chose this option or valuelist in order to provide the height of the bars.
- colorlist
- The list of colors, one for each bar. colorlist also supports the following keywords:
- contrasting: Select colors base on a contrasting color scheme
- modulated: Select colors base on a modulated rainbow color scheme
- rainbow: Select colors base on the rainbow color scheme
- random: Select colors randomly
- up:color: Use color if the value is positive
- down:color: Use color if the value is negative
- labellist
- This list provides the labels to be associated with each bar, point, or pie slice on the resulting graph. The values should contain a comma-separated list of labels, one for each value.
- position
- The position of the graphic relative to the center of the node. This can be expressed as either an "x,y" pair, or using the main compas points: north, northeast, east, southeast, south, southwest, west, northwest or center.
- range
- A comma-separated pair of values that indicates the range of the input values. This may be used to force all charts across a number of nodes to have the same value range. Otherwise each charts will utilize it's own set of values to determine the hight of the bars.
- scale
- A scale factor for the size of the chart. A scale of 1.0 is the same size as the node, whereas a scale of 0.5 is 50% of the node size.
- separation
- The separation between any two bars
- showlabels
- A true/false value to enable or disable the creation of labels.
- size
- This specifies the size of the chart as a widthXheight pair. If only one value is given, it is assumed that the chart is square, otherwise the string is assumed to contain a width followed by an "X" followed by a height.
- valuelist
- The list of values (as a comma-separated list) for each point, bar, or pie slice.
- ybase
- The vertical base of the chart as a proportion of the height. By default, this is 0.5 (the center of the node), to allow for both positive and negative values. If, however, you only have positive values, you might want to set this to 1.0 (the bottom of the node). Note that this goes backwards from what might be expected, with 0.0 being the top of the node and 1.0 being the bottom of the node. The keyword bottom is also supported.
Example:
barchart: attributelist="a,b,c,d" colorlist="up:yellow,down:green"
This will use the values from columns a, b, c, and d and the colors yellow for up and green for down to create a bar chart. The labesl will come form the column names. See the node labeled "Bar Chart" in Figure 1.
Arguments (hyperlinked arguments are the same as described above):
- arcstart
- The angle in degrees to start the pie. 0° points east, 90° points south, etc.
- arcwidth
- The width of each circle
- attributelist
- colorlist
- firstarc
- Where to begin the first circle, as a proportion of the entire node.
- firstarcwidth
- The width of the first circle
- labelcircles
- If true, label the circles. Note that only the outer circle is actually labeld
- labelcolor
- The color of the labels
- labelfont
- The font family to use for the labels
- labelsize
- The font size to use for the labels
- labelstyle
- The font style to use for the labels
- labellist
- minimumslice
- The minimum size of a slice to be considered. All slices smaller than this are grouped together in a single "other" slice
- position
- range
- scale
- showlabels
- size
- valuelist
Examples:
    circoschart: arcstart=90 firstarc=.5 arcwidth=.3 range="-5,5" colorlist="up:yellow,down:blue,zero:black" valuelist="1,1,1,1" showlabels=false attributelist="Circle1,Circle2"
    circoschart: firstarc=.5 arcwidth=.4 colorlist="red, green, blue, white" showlabels=false attributelist="Circle1,Circle2"
The first example starts the first circle halfway out in the node and sets the width of each circle to be 30% of the node width. No labels are shown (see Circos 1 in Figure 1). The second example uses wider circles (see Circos 2 in Figure 1).
Arguments (hyperlinked arguments are the same as described above):
- attributelist
- colorlist
- In the case of the heatstripchart, the colors must be specified using the
"down,zero,up" syntax. Three keywords are provided:
- yellowcyan, which corresponds to "cyan,black,yellow"
- purplegreen, which corresponds to "green,black,purple"
- redgreen, which corresponds to "green, black, red", but in general, this should not be used as it is impossible for color-blind people to interpret.
- labellist
- position
- range
- scale
- separation
- The separation between any two bars
- showlabels
- size
- valuelist
Example:
heatstripchart: separation="1" valuelist=".2,-1,3,1" labellist="cond1,cond2,cond3,cond4"
- color
- Specify the color of the label
- attribute
- The attribute to get the label from.
- background
- A boolean option that causes a translucent background to be painted behind the label and on top of the network.
- bgcolor
- The color of the background.
- dropShadow
- Add a drop shadow behind the label.
- label
- The label to paint.
- labelfont
- The font family to use for the labels
- labelsize
- The font size to use for the labels
- labelstyle
- The font style to use for the labels
- outline
- Outline the font.
- outlineColor
- The color of the outline.
Arguments (hyperlinked arguments are the same as described above):
- attributelist
- colorlist
- labellist
- linewidth
- The width of the line as a floating point value
- position
- range
- scale
- showlabels
- size
- valuelist
- ybase
Example:
linechart: colorlist="up:blue,down:red" attributelist="Values"
Arguments:
- start
- The starting coordinate for the gradient as an X,Y pair.
- stop
- The ending coordinate for the gradient as an X,Y pair.
- stoplist
- The list of colors and proportional distances of the form r,g,b,a,s where r,g, and b are the red, green, and blue values in the range [0,255]; a is the alpha or opacity, also in the range [0,255] where 255 is completely opaque; and s is the stop value from the range [0.0,1.0] where 0.0 is the beginning of the gradient and 1.0 is the end of the gradient. Multiple stops are separated by verticle bars: |.
Example: to specify a gradient that starts red and goes through white to blue:
lingrad: start="0,0" end="1,0" stoplist="255,0,0,255,0.0|255,255,255,255,0.5|0,0,255,255,1.0"This produces the "Linear Gradient" node from Figure 1.
Arguments (hyperlinked arguments are the same as described above):
- arcstart
- The angle in degrees to start the pie. 0° points east, 90° points south, etc.
- attributelist
- colorlist
- labellist
- labelsize
- The integer font size of the label
- minimumslice
- The minimum size of a slice to be considered. All slices smaller than this are grouped together in a single "other" slice
- position
- range
- scale
- showlabels
- size
- valuelist
- ybase
Examples:
    piechart: attributelist="Values" colorlist="contrasting" labellist="First,Second,Third,Fourth,Fifth"
    piechart: attributelist="a,b,c,d" colorlist="red,green,blue,yellow"
The top example uses a List column: "Values" from the node table and specifically assigns labels (see
"Pie Chart" in Figure 1) and the second example uses multiple columns and assigns a specific color
to each column (see "Pie Chart 2" in Figure 1).
Arguments (hyperlinked arguments are the same as described above):
- center
- The center for the gradient as an X,Y pair.
- radius
- The radius of the gradient as a proportion of the node radius
- stoplist
Example: a radial gradient that goes from blue to white to red starting in the middle of the node and covering the entire node:
radgrad: center="0.5,0.5" radius="1.0" stoplist="0,0,255,255,0.0|255,255,255,255,0.5|255,0,0,255,1.0"This produces the "Radial Gradient" node from Figure 1.
Arguments (hyperlinked arguments are the same as described above):
- colorlist
Example: a simple stripe with the colors red, white, and blue middle of the node and covering the entire node:
stripechart: colorlist="red,white,blue"This produces the "Stripe Chart" node from Figure 1.
Last updated: 3/27/2017 enhancedGraphics version 1.1.1
About RBVI | Projects | People | Publications | Resources | Visit Us
Copyright 2021 Regents of the University of California. All rights reserved.